EO Data
Earth observation data (EO data) acquired from spaceborne, aerial and other platforms at different spatial, spectral, and temporal intervals has immensely improved the ability to monitor the condition of agriculture. This is particularly true in areas where access to field information is limited and smallholder subsistence agriculture dominates. In many ‘countries at risk’, agrometeorological and remote sensing information is often the first and even the sole source of information on crop conditions, allowing rapid and large-scale assessment of potential weather-related impacts on agricultural production. EO data sets are often used to identify anomalies that can be associated with potential agricultural impacts and are used together to provide a robust basis for convergence of evidence of agricultural conditions, which is especially useful when field reports are unavailable. Additionally, EO data sets are operationally being used in many counties to make pre-harvest production forecasts and in assessing the impact of drought.
Listed here are some of the key EO data products being used in agricultural monitoring, which can also be found in the Crop Monitor Exploring Tool for visualization.
NDVI & NDVI Anomalies
Normalized Difference Vegetation Index (NDVI) measures vegetation by measuring the difference between near-infrared and red light (see formula below). Healthy vegetation (chlorophyll) reflects more near-infrared (NIR) and green light compared to other wavelengths while absorbing more red and blue light. This is why our eyes see healthy vegetation as the color green.

The NDVI values range between -1 and 1, where values are higher and close to 1, there is a higher vegetation content or healthier vegetation. Lower values close to or below zero indicate less vegetation or a lack of vegetation. Therefore, NDVI provides an estimation of the state and/or amount of vegetation.
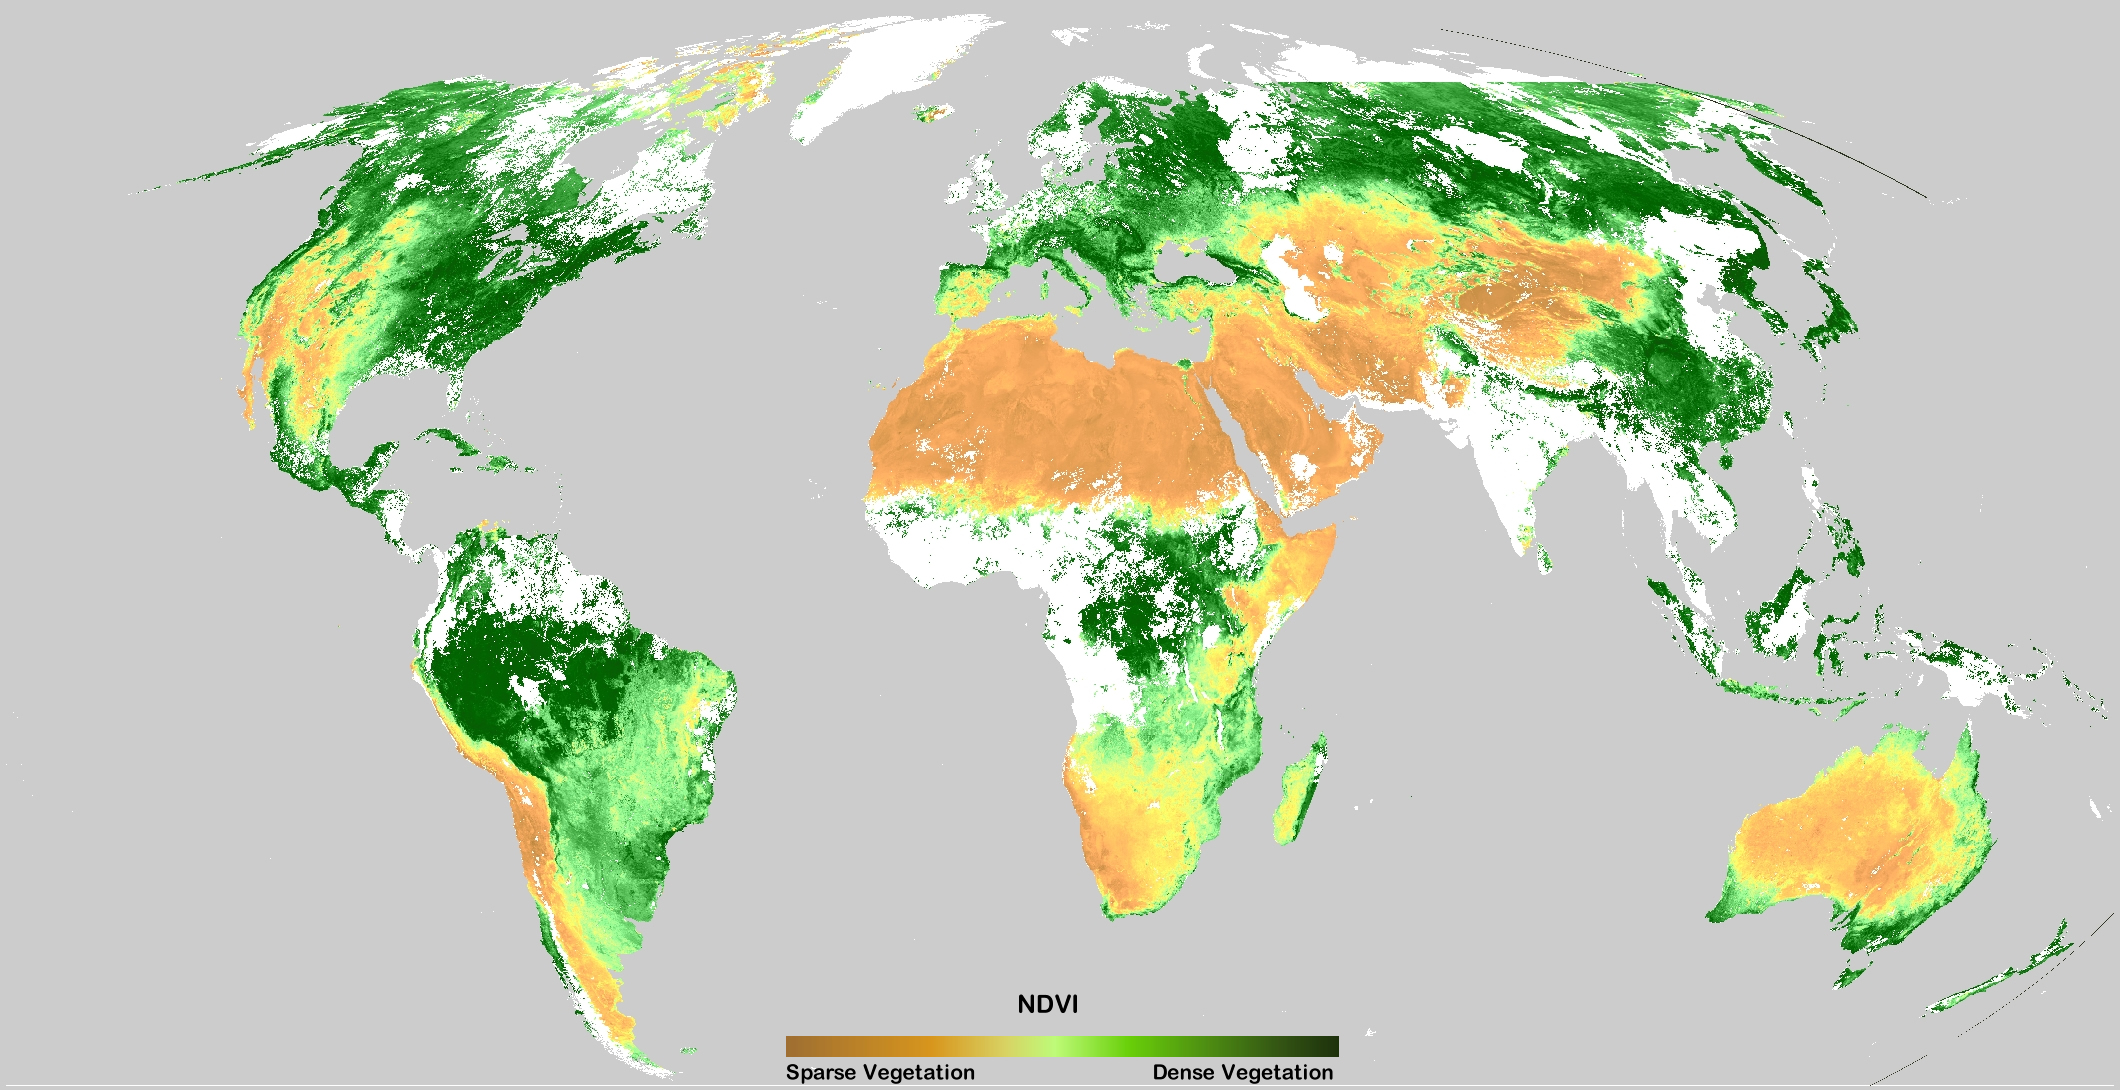
Global NDVI showing areas of dense vegetation and areas of sparse or no vegetation. Areas in white are missing data due to high levels of cloud cover
An NDVI Anomaly is the difference between the averages NDVI over a particular time step compares to the average NDVI for the same time step across a specific number of years, typically between 5 to twenty years. Anomalies are used to characterize the health of the vegetation for a particular time step compared to what is considered normal. In agricultural monitoring, negative values can be a good indicator of poor crop conditions or a slower growth rate of the crop due to a variety of environmental conditions such as drought or a significantly delayed season (such as in the case of the 2019 spring crops in the U.S. Corn Belt).
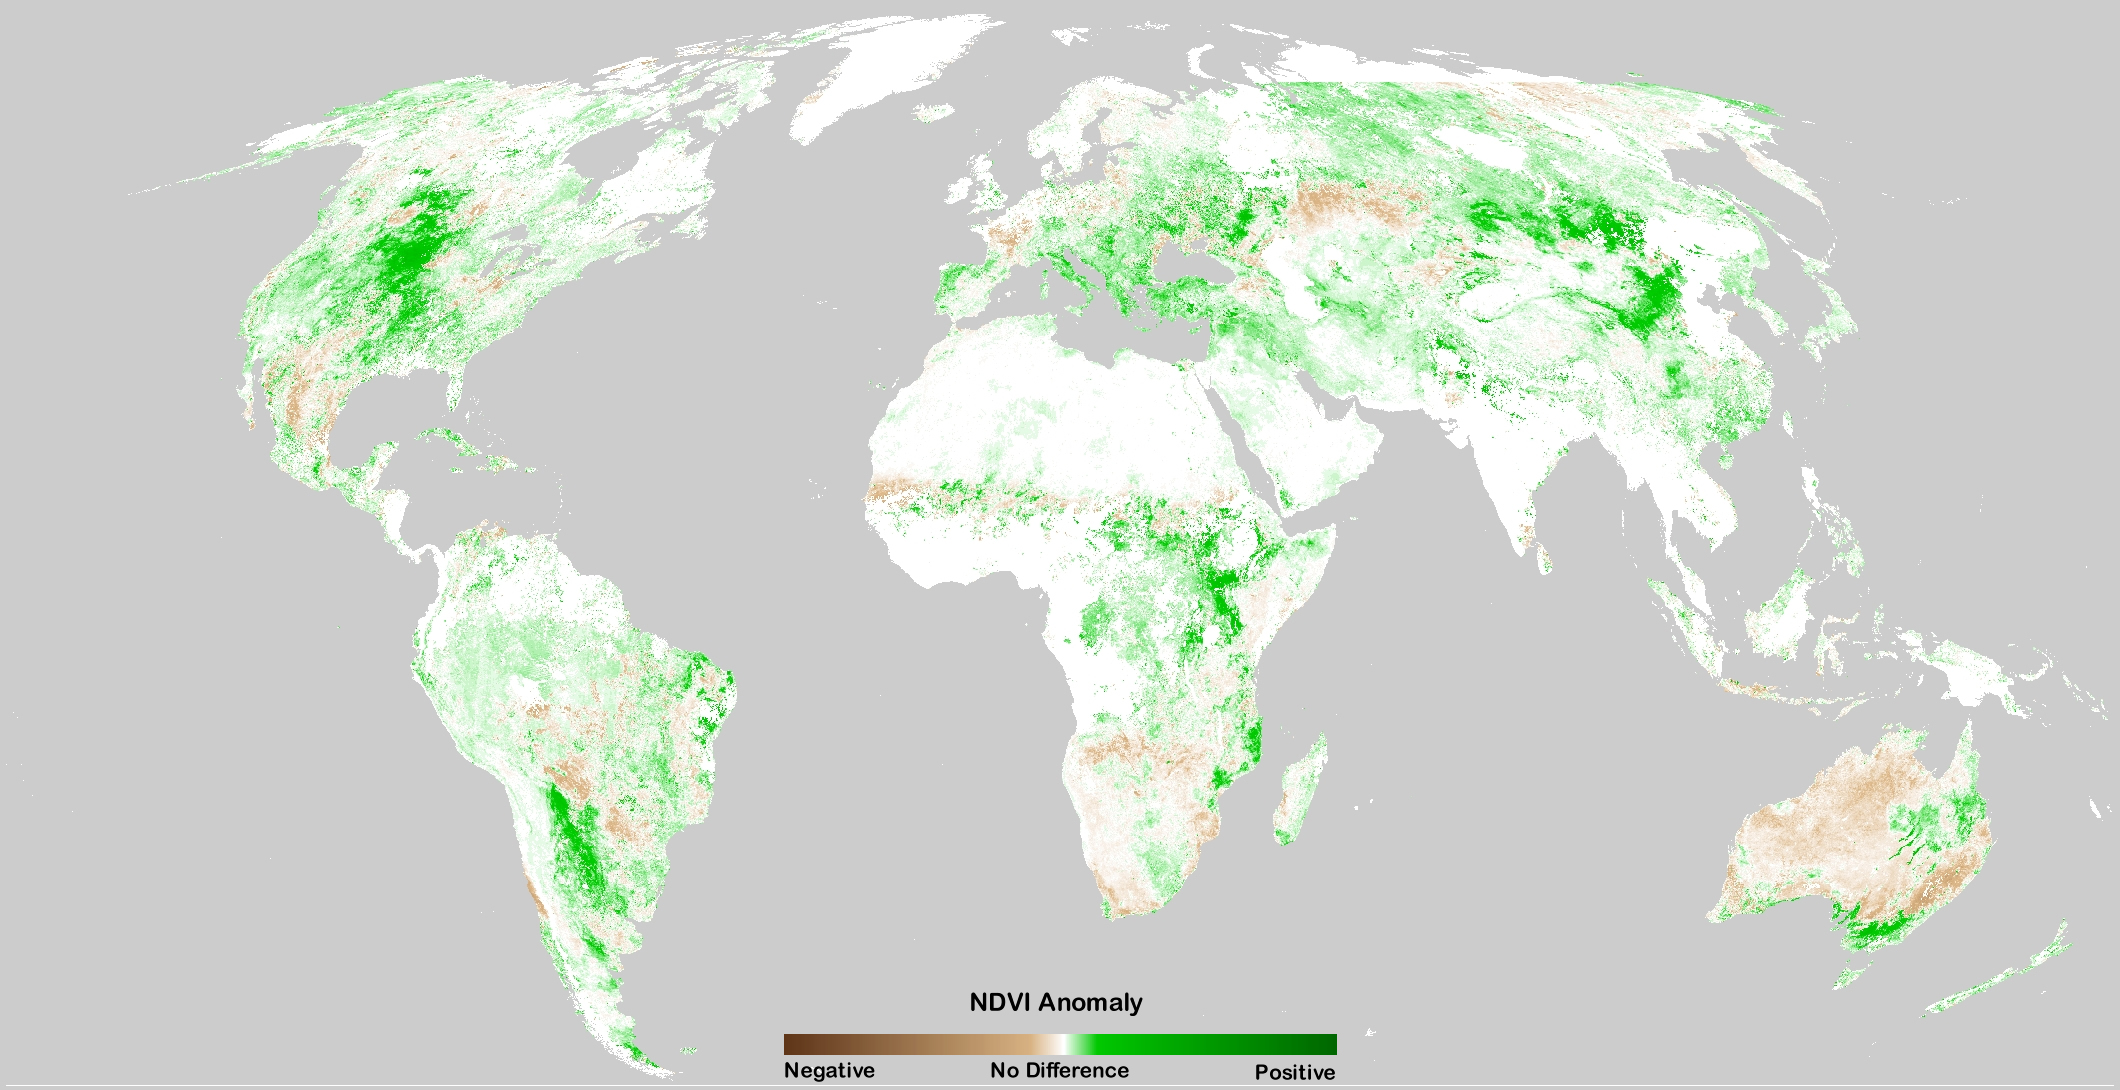
Global NDVI Anomaly at the same time as the above image. Green represents regions with above-average biomass while areas in brown represent areas of below-average biomass. The darker the color the further from normal the values are.
Data Source: NASA MODIS Vegetation Index Products
Temperature
Temperature is a major factor in affecting the rate of agricultural crop development. All biological and chemical processes taking place in crops and the soil are connected with air temperature. Crop growth takes place within a broad set of temperature limits. At the lower limit is the minimal temperature allowable for crop growth to begin, which is typically just a bit higher than freezing. While at the upper limit is the maximum temperature where crop growth stops and can cause irreversible damage to crop function or development, which can vary depending on the specific crop. Temperature swings in either direction, as either a frost or a heatwave, during the growing season can cause crop losses or reductions in yields.
Temperature anomalies provides information about the deviation of the average temperature from the long-term average temperature over the same period. Anomalies are typically done over set periods, such as months so that they provide cumulated temperatures within a month compared to the historical median of cumulated temperatures in the same month. Negative cumulated temperatures indicate the cumulated temperatures of the month has been lower than the long-term average values. On the contrary, positive cumulated temperatures indicate temperatures higher than the long-term average. Higher negative or positive values of cumulated temperature anomaly indicate that the deviation of temperatures was sustained over time. Therefore, they point to regions where crops may be susceptible to alterations in crop phenology cycle or adverse effects on crop health.
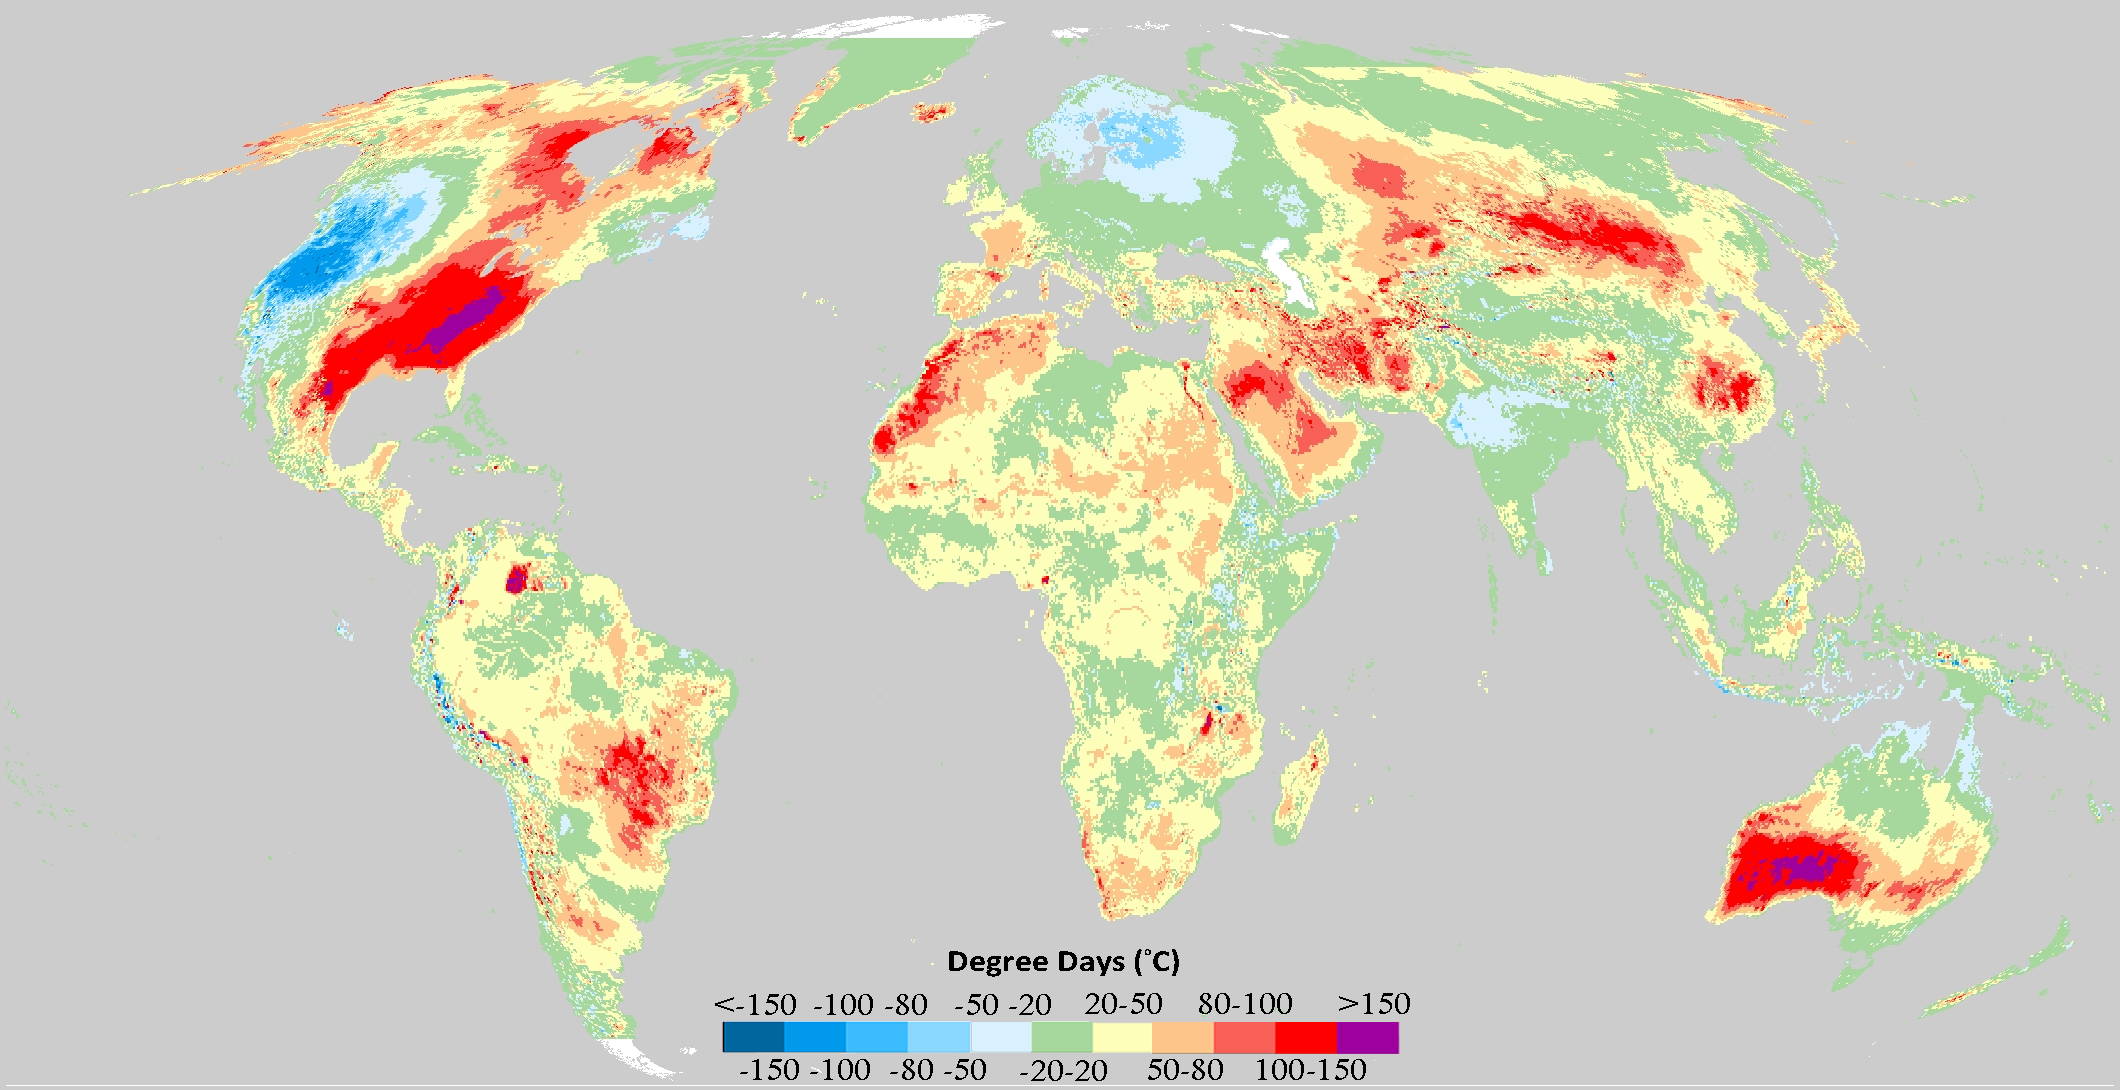
Temperature anomaly between the cumulative temperatures within a month and the historical median of cumulated temperatures in the same month.
Data Source: ECMWF Public Datasets
Precipitation
Precipitation, especially rain, is extremely important for agriculture. All crops require water to survive and develop. While a regular rain pattern is usually vital to healthy crops, too much or too little rainfall can be harmful, even devastating to crops. Drought can kill crops, while overly wet weather can prevent fieldwork, cause erosion, or facilitate the growth of harmful fungus. Precipitation can also be spatially variable, where large differences can often occur across small distances. Therefore, precipitation is one of the more important meteorological parameters to consider when monitoring crops.
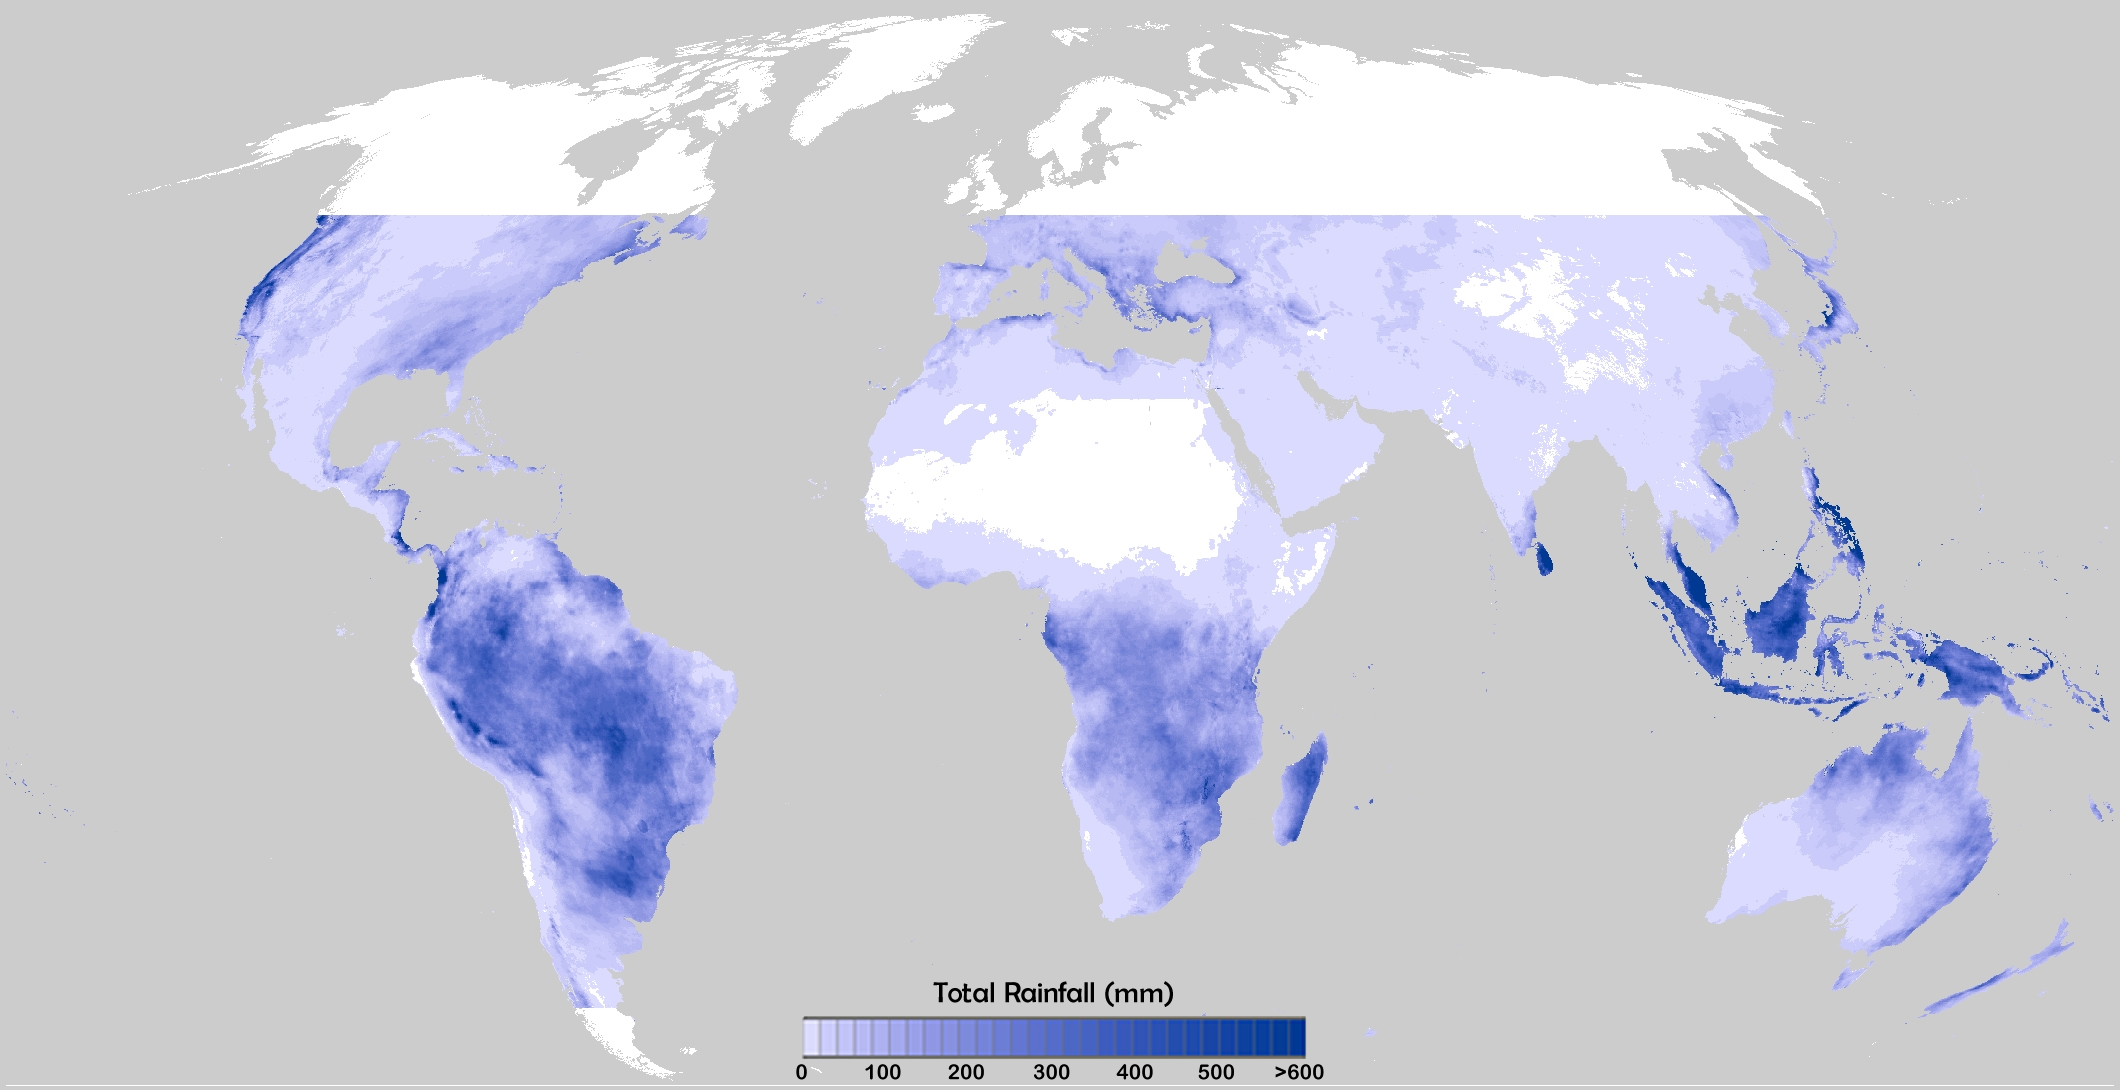
Total rainfall from CHIRPS over a 1-month period measured in mm. Areas in white are missing data or recording no precipitation.
Precipitation anomalies provides information about the deviation of the average precipitation from the long-term average precipitation over that same period. Negative cumulated precipitation values indicate the precipitation of the period has been lower than the long-term average values, suggesting meteorological drought conditions. On the contrary, positive cumulated precipitation values indicate precipitation volume higher than the long-term average, pointing to flooding events or an intense rainy season. Both of these situations have a direct effect on crop health and phenology cycle. Therefore, the information offered by the cumulated precipitation anomalies help crop analysts to monitor and predict crop conditions.
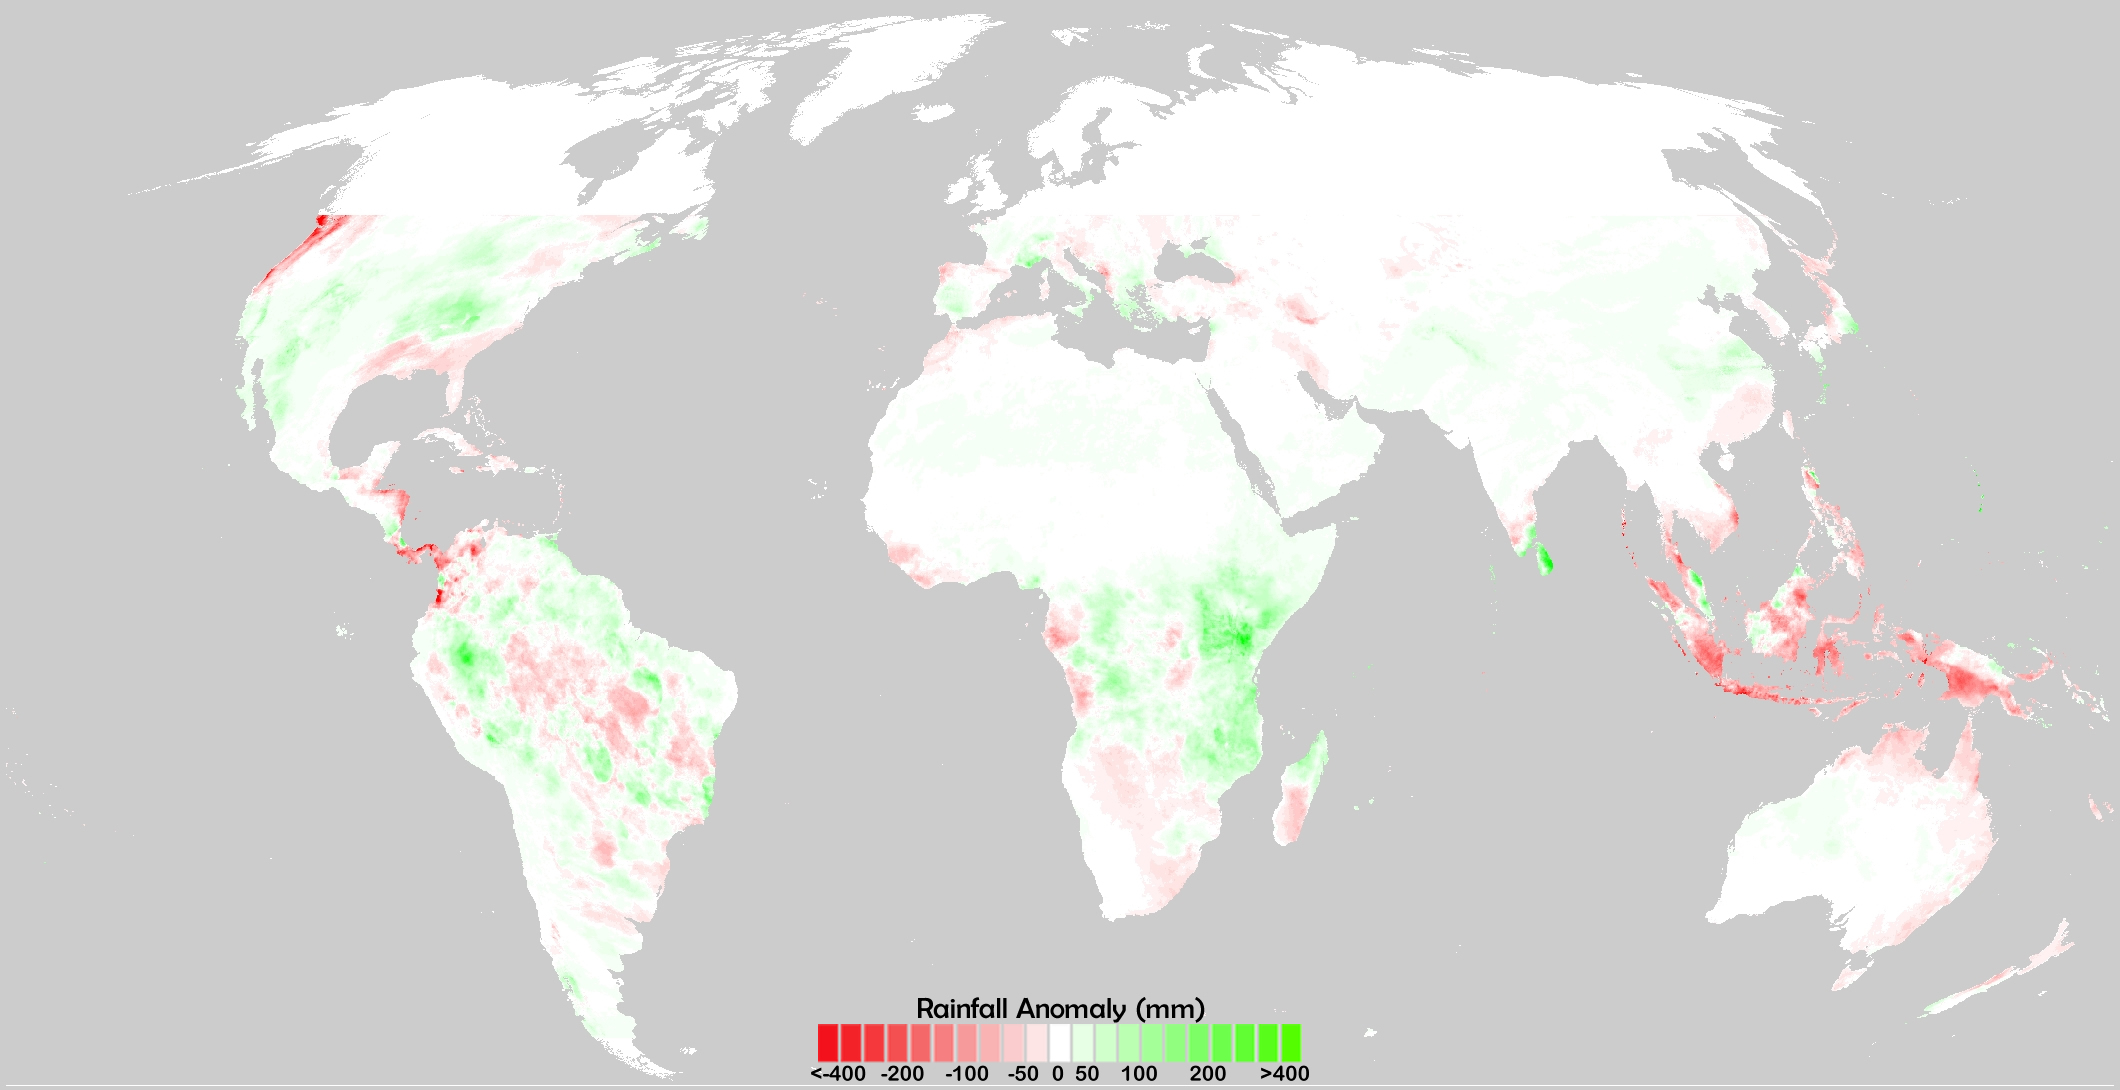
Rainfall anomaly from CHIRPS over a 1-month period measured in mm. Areas in white are missing data or recording no deviation in precipitation compared to normal.
Data Source:
Soil Moisture
Surface soil moisture is an important variable for crop growth and is the measurement of the amount of water stored in the soil on the surface of the soil particles, as well as in the pores between individual soil particles. The amount of moisture in the soil will depend on meteorological conditions (rain, heat, sun exposure, and wind), runoff/drainage, and soil type (which dictates the size of the pores). If there is less water in the soil, it will be more difficult for crop roots to take up that water, resulting in a crop that is under greater stress. If the stress continues, the crop will wilt and eventually die. However, if the soil is above field capacity and the pores are oversaturated with water then oxygen levels are restricted and it can be detrimental for the crop.
Soil moisture anomalies are computed to compare current conditions to historical conditions over the same period. These anomalies are used to detect and monitor agricultural drought, which is when there is reduced crop production due to insufficient soil moisture. Agricultural drought is preceded by meteorological drought, which is detected and monitored using precipitation products.
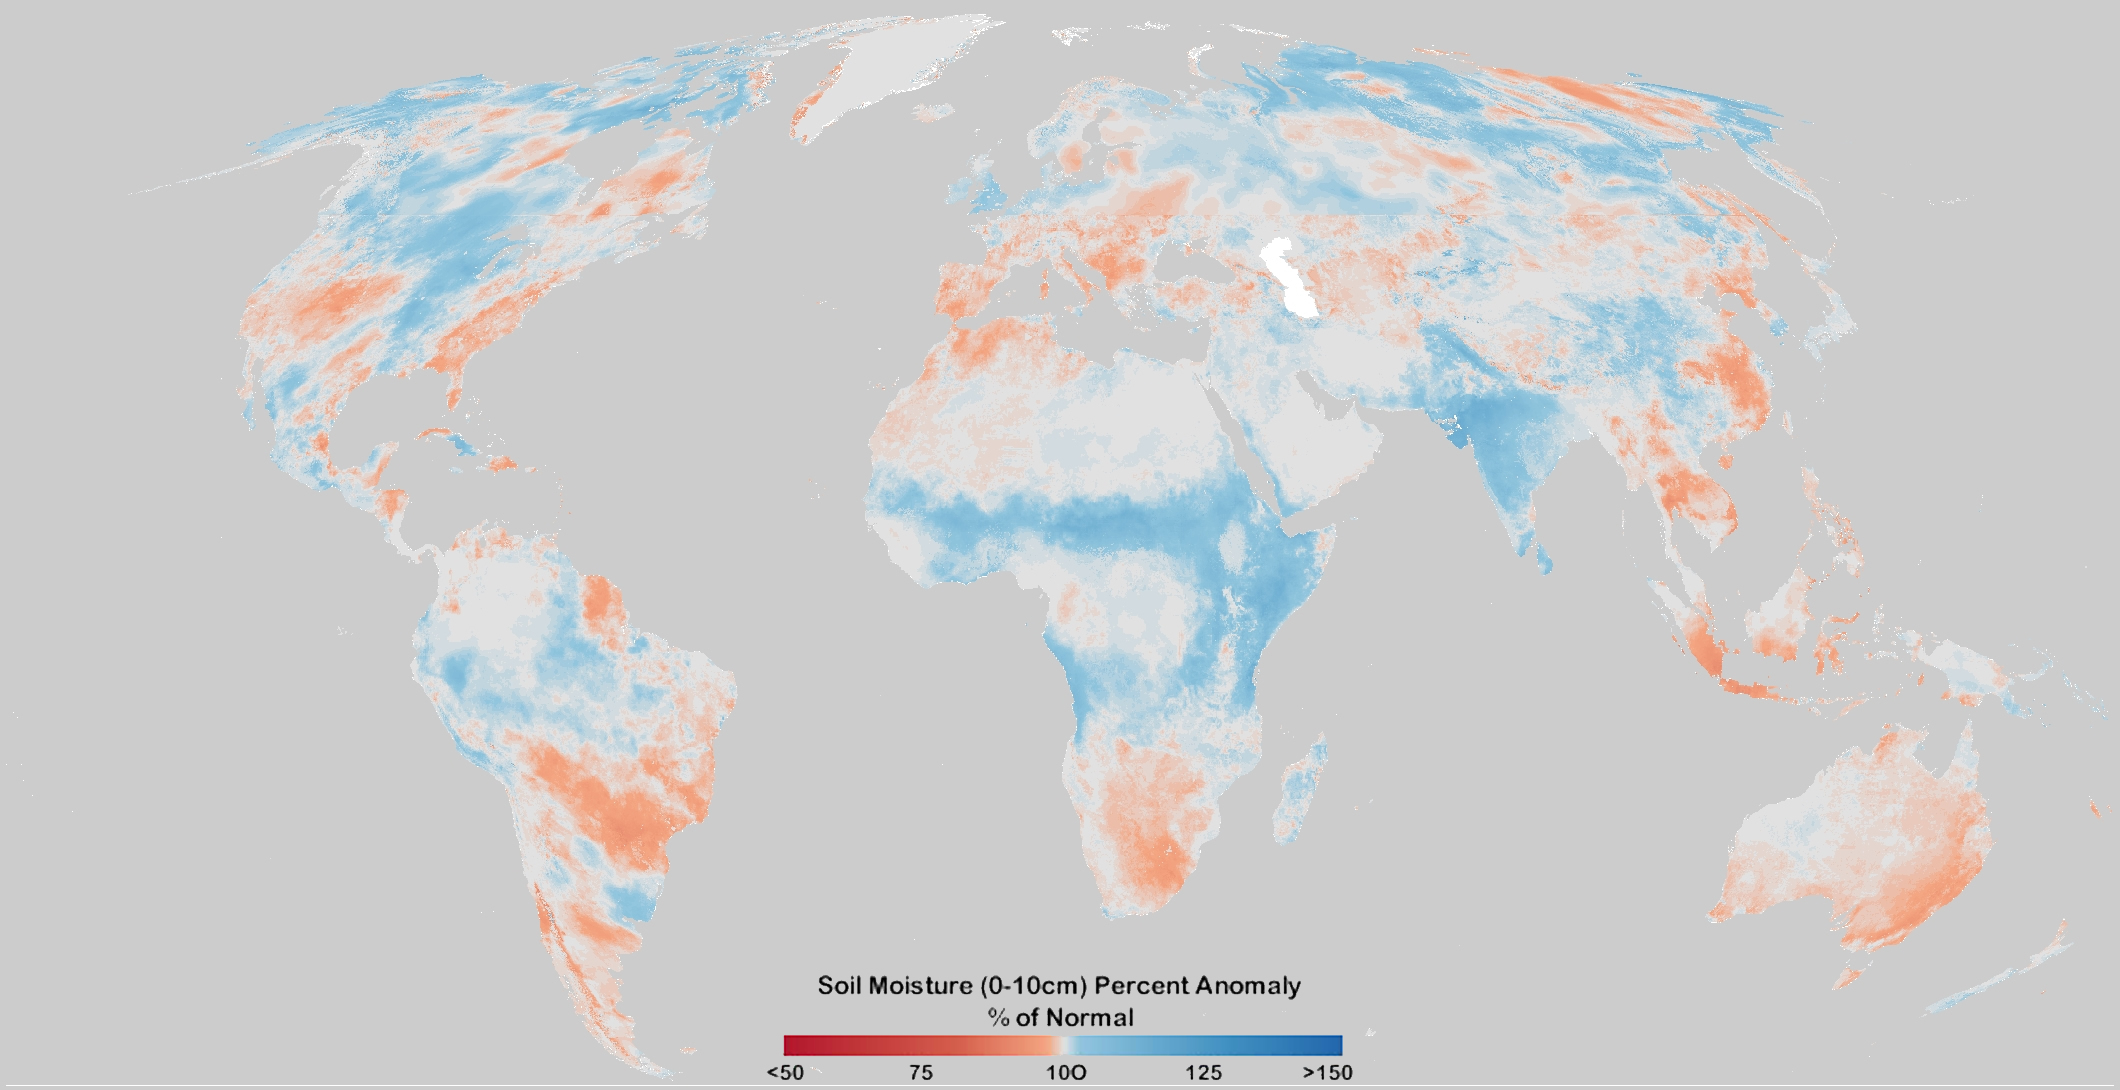
Surface Soil Moisture Percent Anomaly as a percent of normal.
Data Source:
Evapotranspiration
Evapotranspiration (ET) is the sum of evaporation from the land surface plus the transpiration from plants. Transpiration is generally the evaporation of water from plant leaves. Crops draw water and nutrients up from the soil into the stems and leaves. Some of this water released into the air as water vapor by transpiration. Energy is required to change the water inside the leaves from liquid to vapor. Direct solar radiation and, to a lesser extent, the ambient air temperature provide this energy. Transpiration rates also vary widely depending on additional environmental conditions, such as humidity, precipitation, soil type, soil moisture, wind, and land slope. During dry periods, transpiration can contribute to the loss of moisture in the top layer of soil where the roots are located, which can have a negative effect on crops.
There are a number of products that describe temporal anomalies in ET, highlighting areas anomalously high or low rates of water use across the land surface (Evaporative Stress Index (ESI) from NOAA, the Actual Evapotranspiration anomaly (Eta) from USGS, and the Evapotranspiration (ET) anomaly from FLDAS). These ET products can sometimes also capture early signals of “flash drought”, whereby extended periods of hot, dry and windy conditions leading to rapid soil moisture depletion.
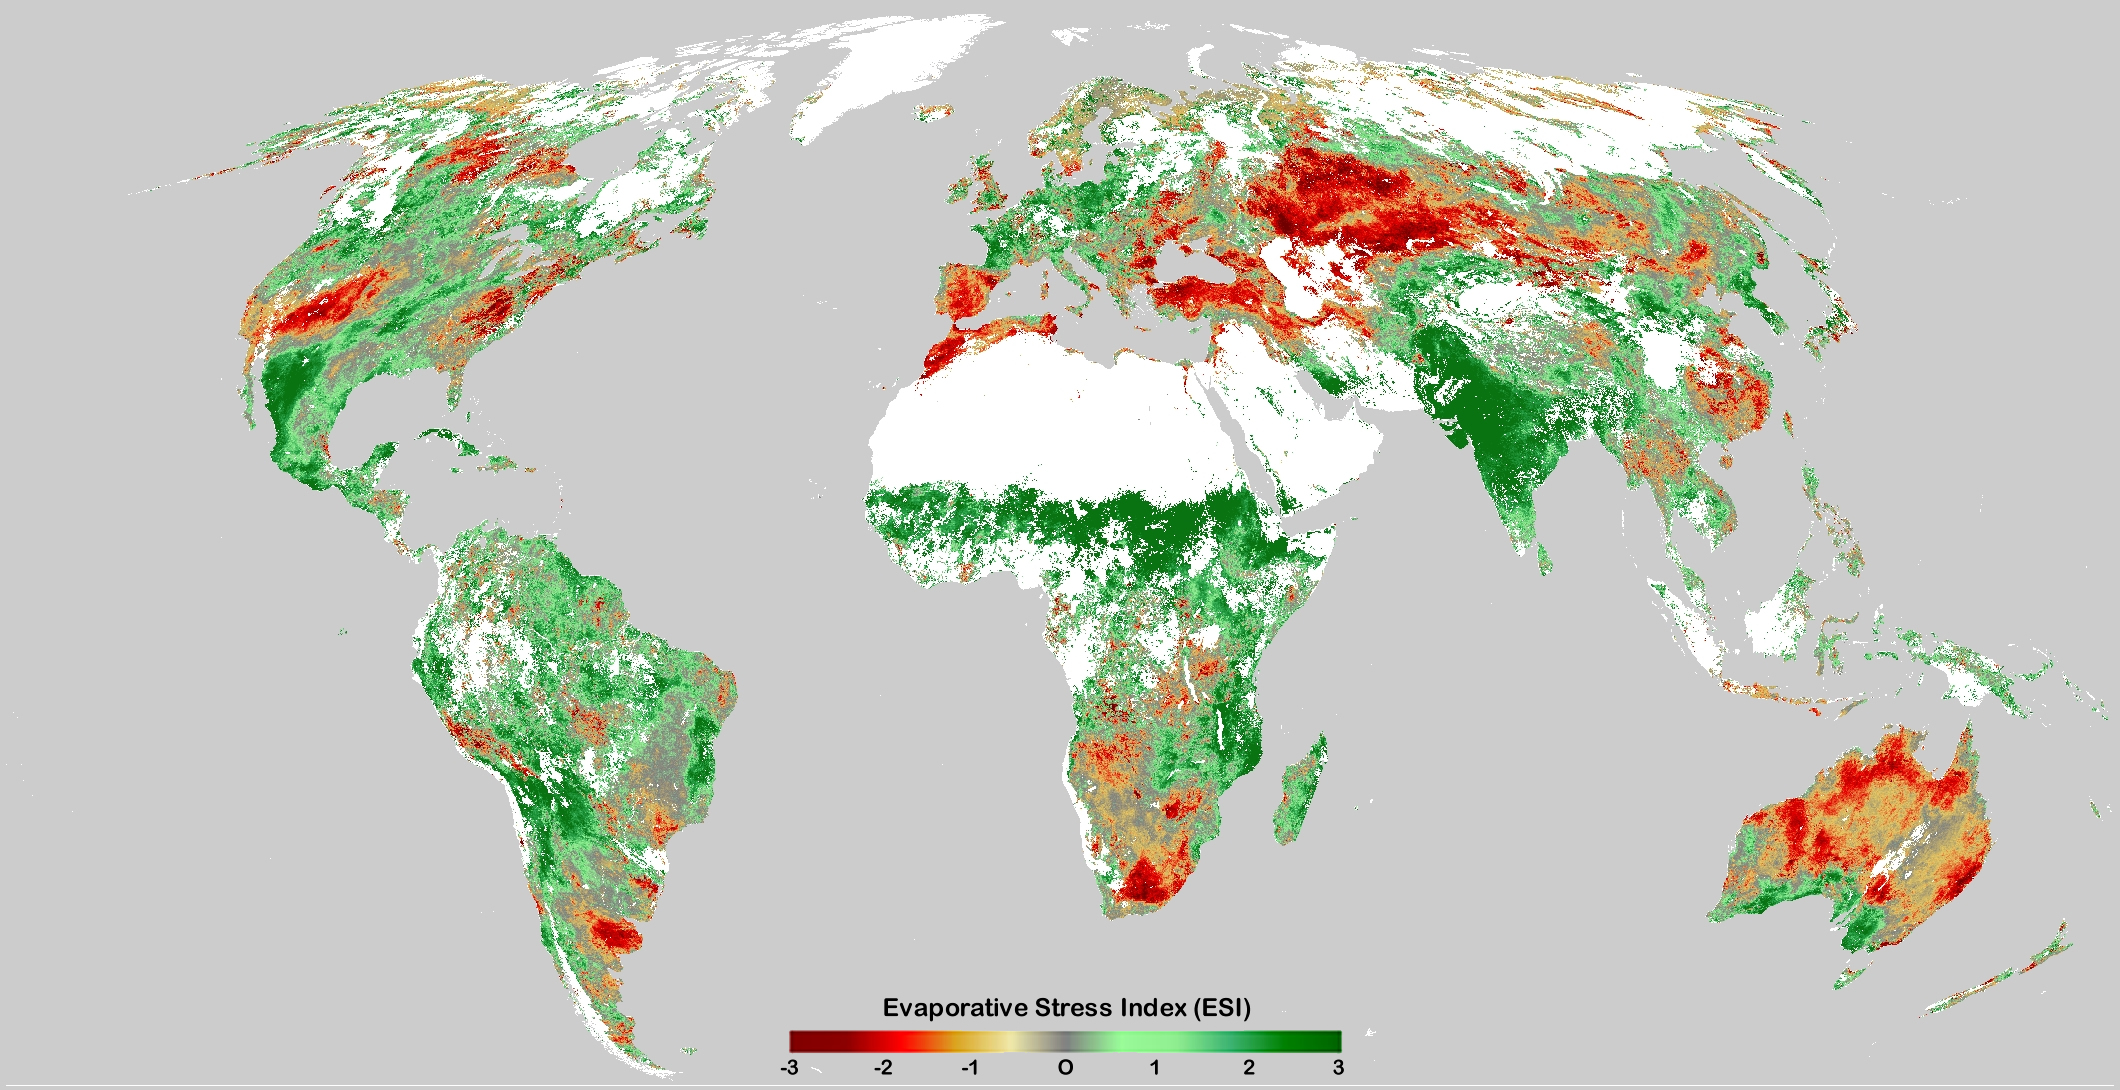
Evaporative Stress Index (ESI) showing anomalously drier than normal conditions (negative numbers) and anomalously wetter than normal (positive numbers) use across the globe. White indicates areas of no data.
Data Sources:
Runoff
Surface Runoff is an important variable that indicates the amount of surface water available after precipitation has been partitioned into evapotranspiration and soil moisture storage. In agricultural monitoring activities, runoff servers as an indicator of available surface water that may be used for domestic, livestock, or agriculture (irrigation) purposes. Total runoff anomalies that show higher values can indicate flooding conditions that may have negative impacts on crops and human populations. Lower surface runoff anomaly values can indicate drought conditions where streams and reservoirs are not receiving the normal amount of surface runoff as usual, potentially affecting the availability of water for irrigation.
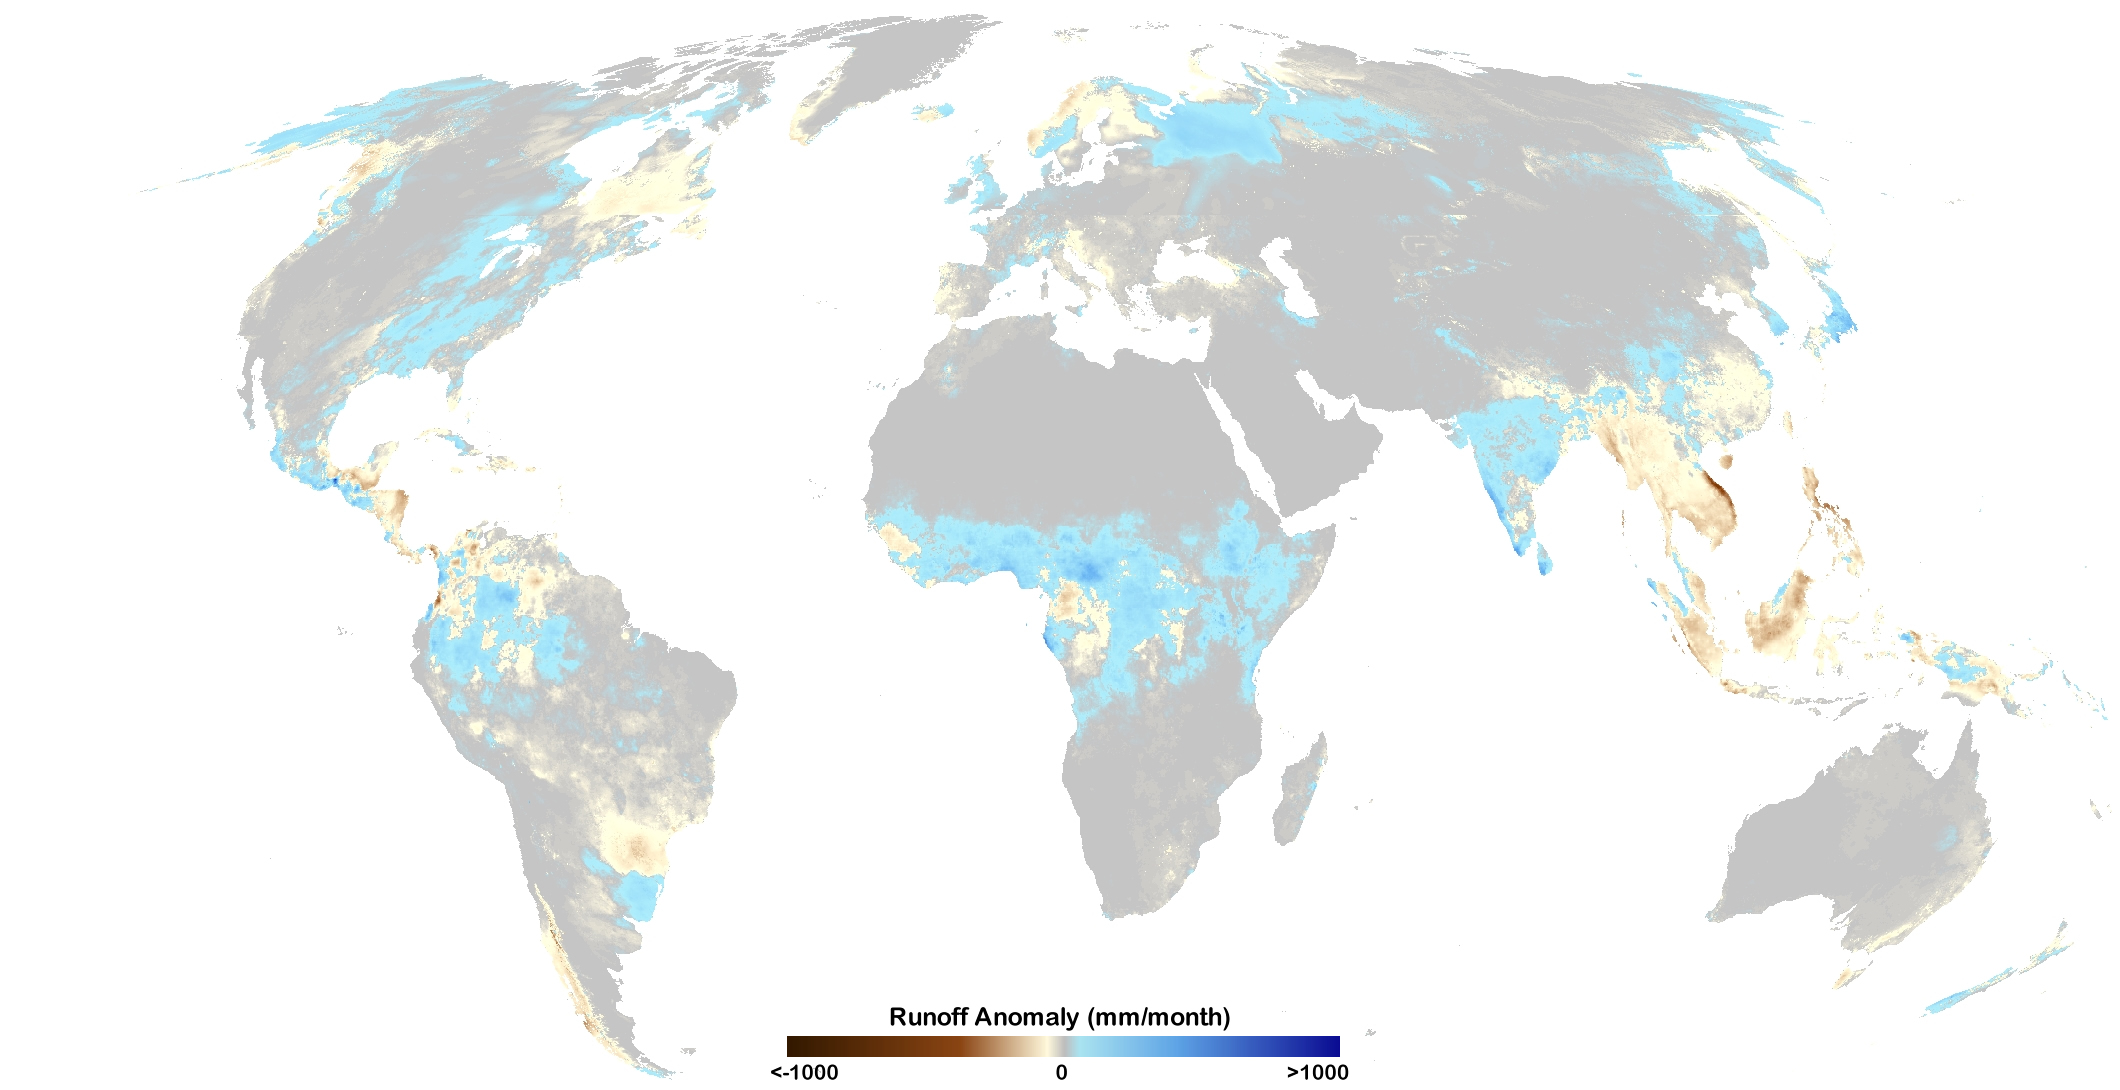
Total Runoff Anomaly showing regions with excess and deficient surface water runoff compared to normal.
Data Source: FEWS NET Land Data Assimilation System (FLDAS)

