AGMET EO Indicators Explained
The GEOGLAM-NASA Harvest Agrometeorological (AGMET) Earth Observation (EO) Indicators bring together a variety of Earth Observation (EO) data products on the sub-national scale, each of which provides valuable insights on in-season crop development and current crop conditions. Combined, each EO data plot helps tell the story of in-season crop conditions through the use of different climate, environmental, and vegetative variables. Detailed descriptions of the different components within the crop condition plots can be found below and in the corresponding NASA Harvest article.Further in-depth discussion on different EO data products for crop monitoring can be found on the EO Data page.
EO data plot components
Basic components:
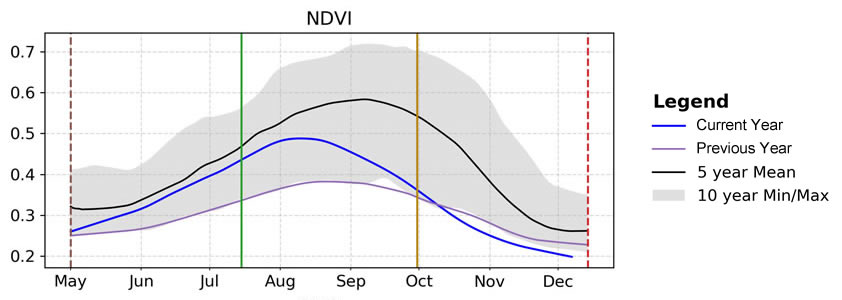
Within each plot, there are several main components. The light gray area shows the span of the most recent 10-year minimum and maximum values across the season in order to provide a better understanding of the particular EO data product’s variability over time. The black lines show the most recent 5-year mean values across the season in order to demonstrate what average conditions usually represent. The purple lines show what the values were across the previous season. The blue lines show what the values are for the current season in near real-time as the season progresses.
Crop Calendars:
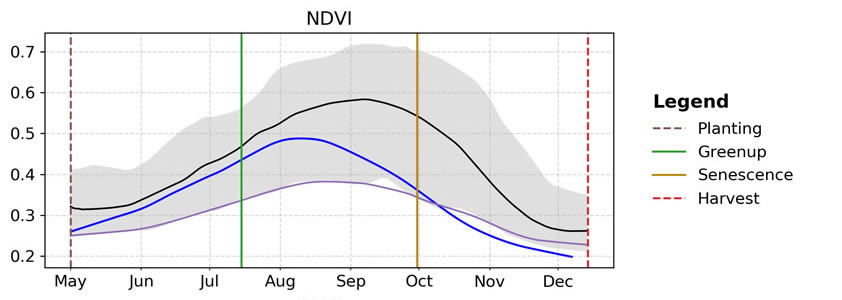
Each plot consists of four vertical lines to provide a reference for where crops are in the development stage, based on the GEOGLAM Crop Monitor crop calendars. The brown dotted line represents the planting stage, the green solid line represents greenup (the beginning of plant growth), the brown solid line represents senescence (late development stage), and the red dotted line represents the end of harvest. By examining the main components of each plot within the context of where crops are in their development cycle, analysts can better interpret how current conditions may impact the remainder of the season and final crop outcomes.
For more information about the crop calendars, please see the crop calendars section of the baseline data.
Normalized Difference Vegetation Index (NDVI):
There are two plots for NDVI. The first plot shows the NDVI values for the current season in comparison to the 5-year mean, values from the previous season, and the 10-year minimum and maximum values. As a crop season progresses, NDVI values will increase during early crop growth and development of leafy vegetation. NDVI will then reach the peak as the crop fully develops and reaches maturity, before senescence, and then decreases again as the crop matures and senesces as the leafy vegetation begins to die off. How the NDVI values progress over the course of the season and the individual peak values can help predict the productivity of the crops. The second NDVI plot shows the comparison of the current season NDVI values with the previous five seasons along with the resulting average crop yields from those seasons.
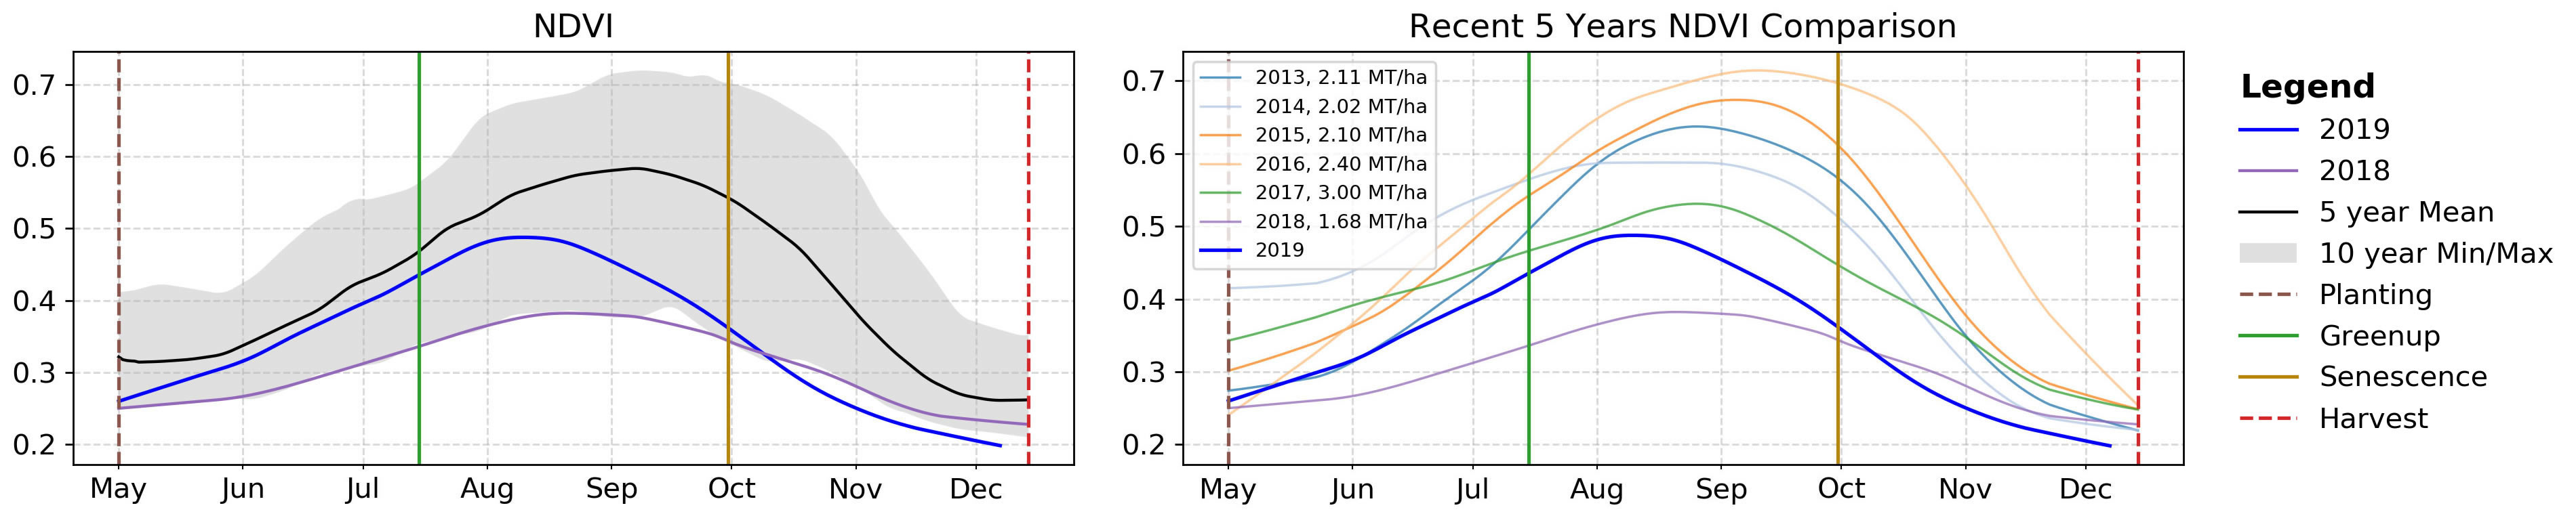
For more information on using NDVI data for crop monitoring please see the NDVI section of the EO Data.
Evaporative Stress Index (ESI):
The Evaporative Stress Index (ESI) estimates water loss due to evapotranspiration (loss of water from soil evaporation and from transpiration through plant leaves). The plot shows the current season’s values as compared to the 5-year mean, values from the previous season, and the 10-year minimum and maximum values. Negative values indicate below-normal evapotranspiration rates, representative of crops that are stressed due to inadequate soil moisture. ESI is good at identifying soil moisture deficits in the early stages and is able to capture flash droughts, which is the quick onset of drought brought on by periods of hot, dry, and windy conditions.
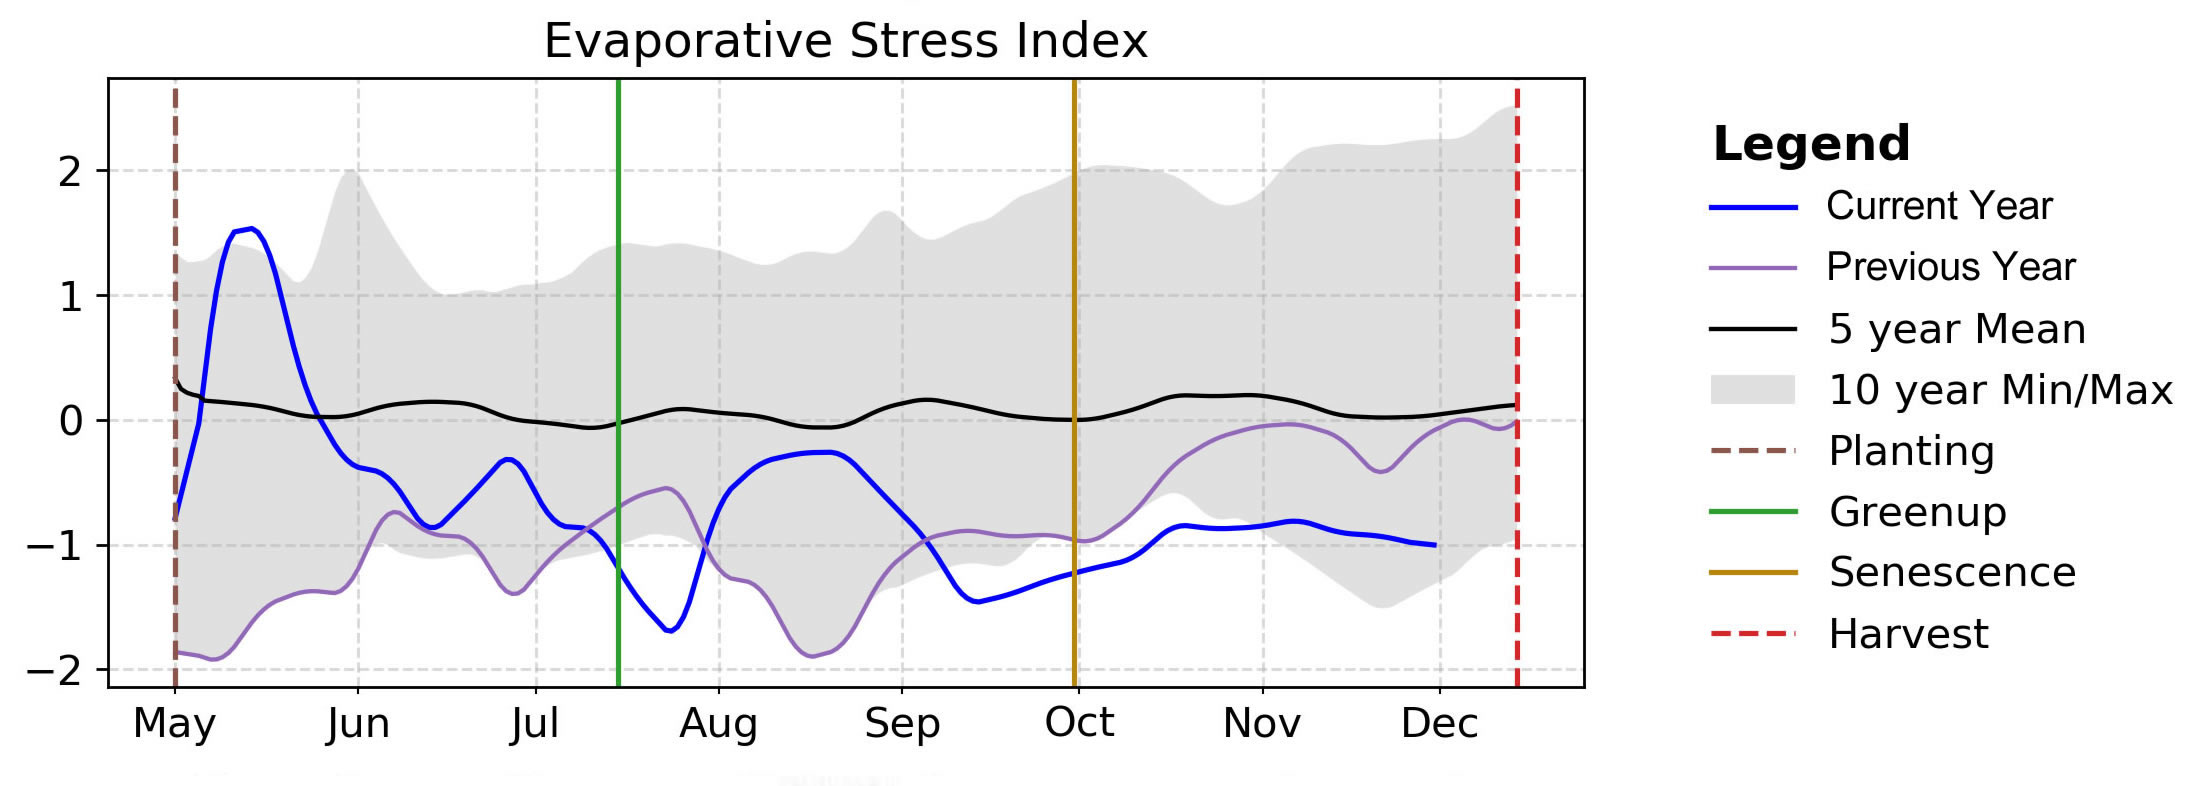
For more information on using evapotranspiration data for crop monitoring please see the Evapotranspiration section of the EO Data.
Precipitation:
There are two plots for precipitation, both of which are measured in millimeters. The first plot shows the current season’s cumulative precipitation compared to the 5-year mean. When the cumulative precipitation goes above the 5-year mean, the area between the current values and the 5-year mean is colored in green to indicate above cumulative average rainfall. When the cumulative precipitation goes below the 5-year mean, the area between the current values and the 5-year mean is colored in red to indicate below average cumulative rainfall. In addition to recorded precipitation, the chart shows the 15-day forecast precipitation as a dot, either green or red to indicate if the forecast will place the cumulative precipitation up above or below the 5-year mean. The second plot shows the daily precipitation events for the season across time, helping to identify the evenness of rainfall over time or major rainfall events.
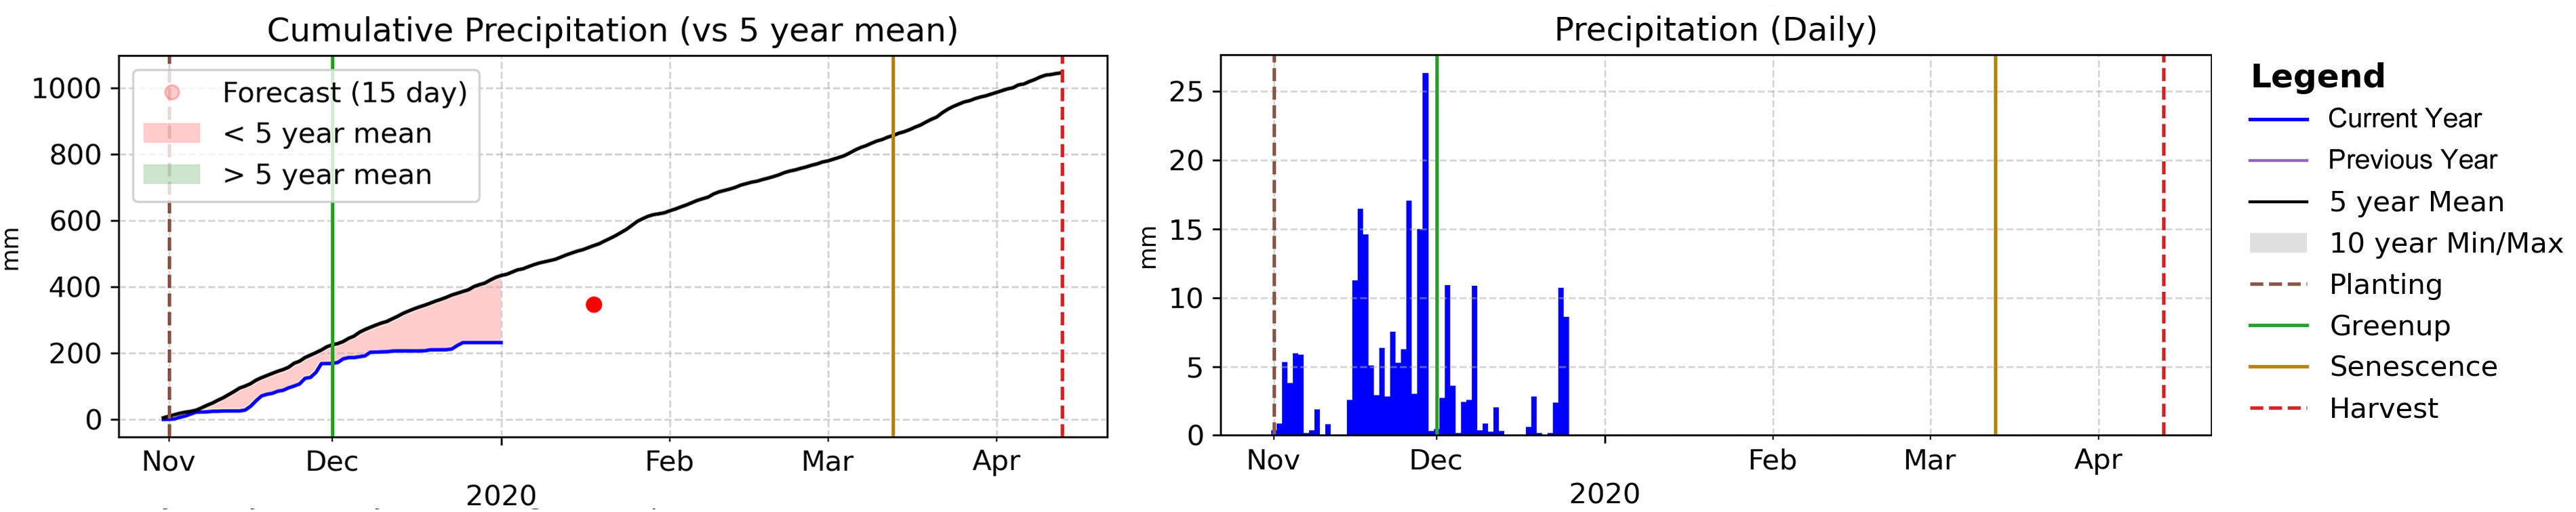
During the course of the season, the timing and the amount of rainfall surpluses or deficits can have different effects. As an example, too much rainfall during sowing can prevent farms from planting crops and flooding events can cause dramatic yield reductions. Alternatively, not enough rainfall early in the season can prevent sown crops from emerging and properly developing.
For more information on using precipitation data for crop monitoring please see the Precipitation section of the EO Data.
Soil Moisture (Surface):
Surface Soil Moisture measures the amount of available water held in the top five-to-ten centimeters of the soil (depth dependent on soil texture). The plot shows the current season’s values as compared to the 5-year mean, values from the previous season, and the 10-year minimum and maximum values. Up to a maximum of 25 millimeters (mm) of available water is able to be held in the surface soil. Higher soil moisture values during the early development stage help crops to germinate and grow. Mid-range soil moisture values during the season help promote crop growth and root depth. However, lower values typically any time before senescence can cause stress in the crops and stunt development.
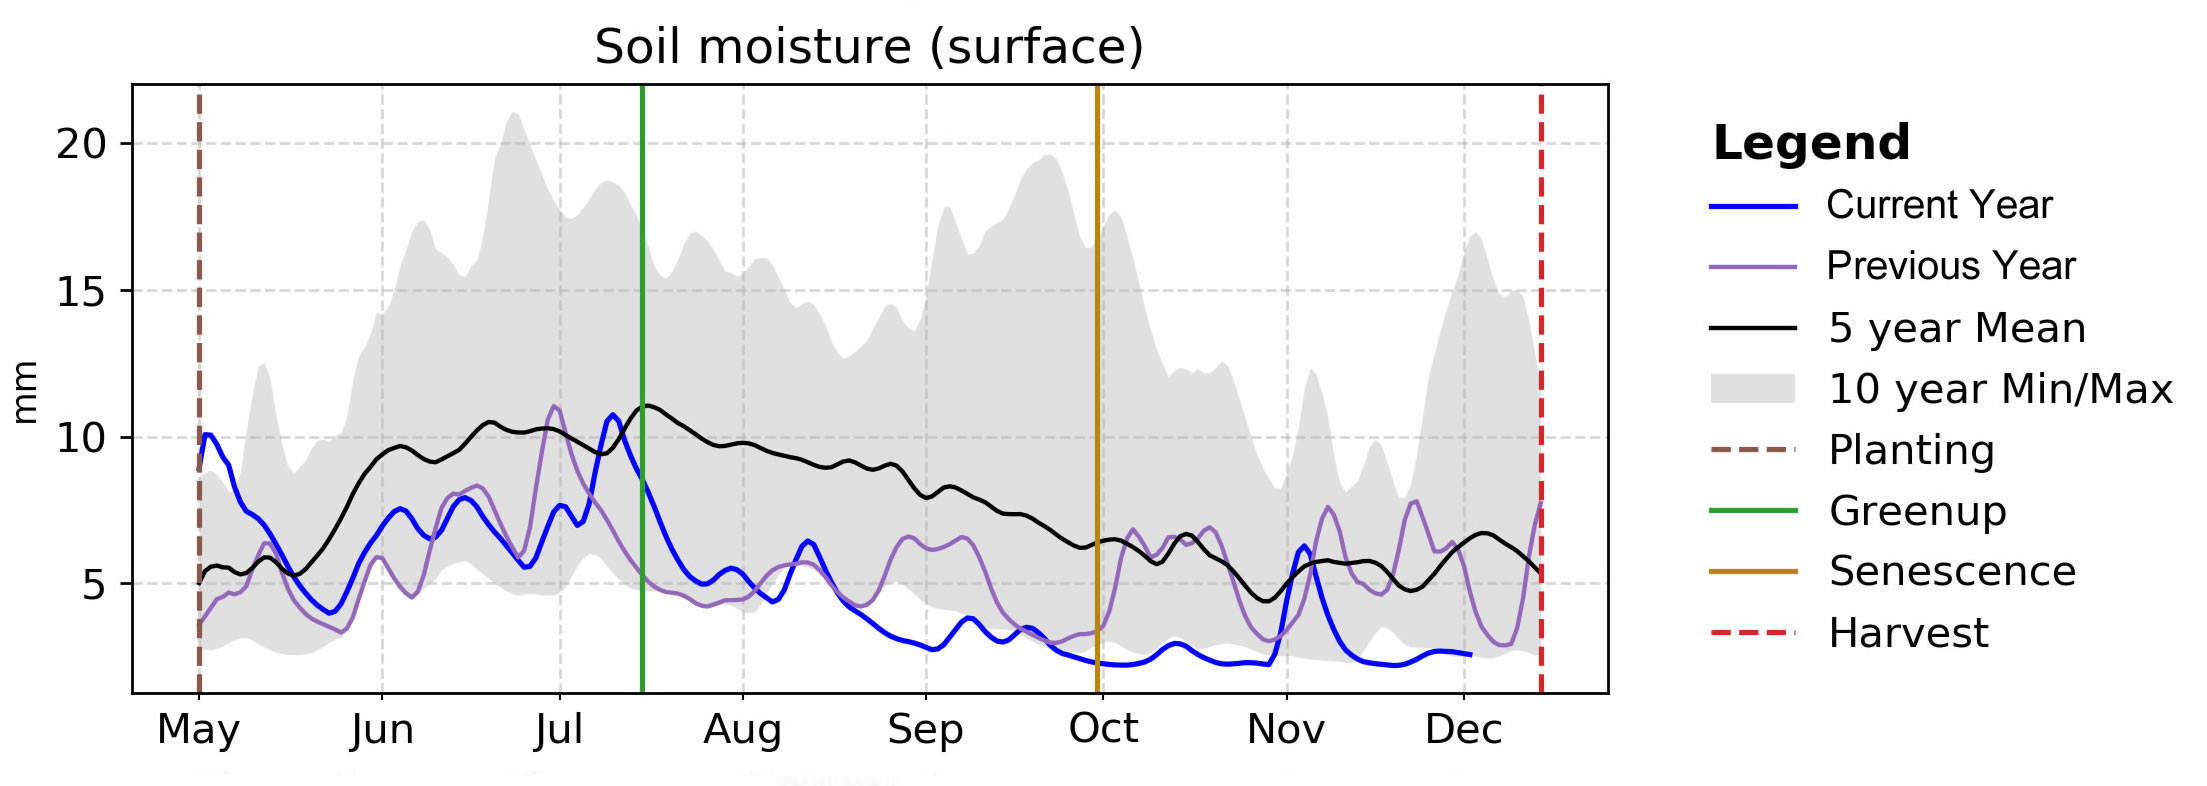
For more information on using soil moisture data for crop monitoring please see the Soil Moisture section of the EO Data.
Temperature:
There are two plots for temperature, both of which are measured in degrees Celsius. The first plot tracks the maximum daily temperature values while the second plot tracks minimum daily temperatures. Both plots show the current season’s values as compared to the 5-year mean, values from the previous season, and the 10-year minimum and maximum values. Very high temperatures can affect crops in a number of ways such as the increase of water loss through increased evapotranspiration, slow plant growth, reduce yields, pollen abortion, and potentially thermal death. Very low temperatures can also affect crops through the slowing in crop growth, frost or chilling injury, reduced seed quality, and possible yield reductions.
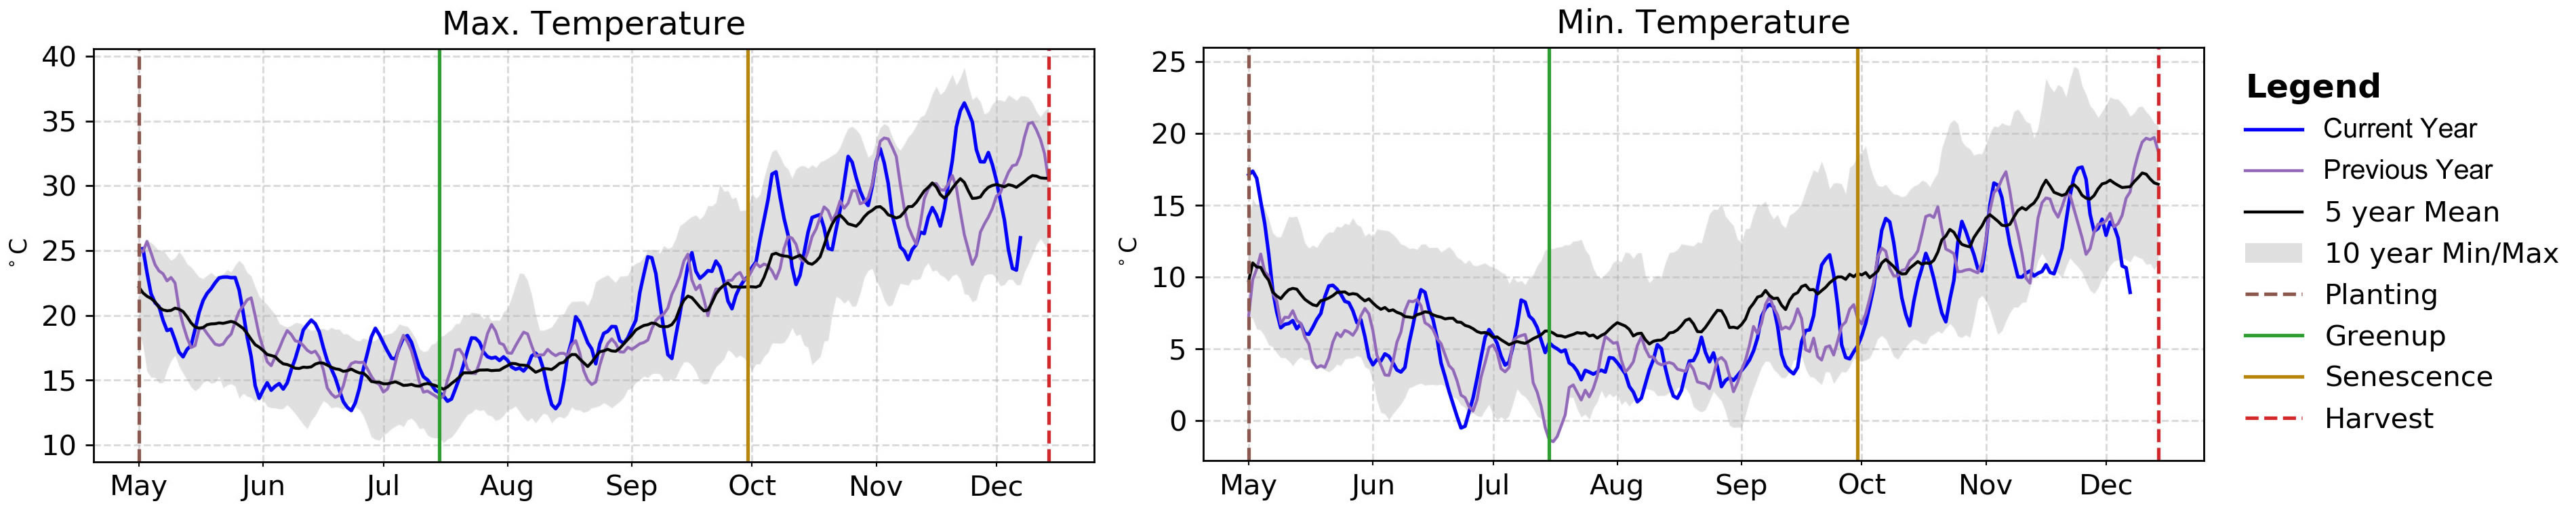
For more information on using temperature data for crop monitoring please see the Temperature section of the EO Data.
AGMET Indicators taken as a whole
Example: 2019-2020 wheat season in New South Wales, Australia
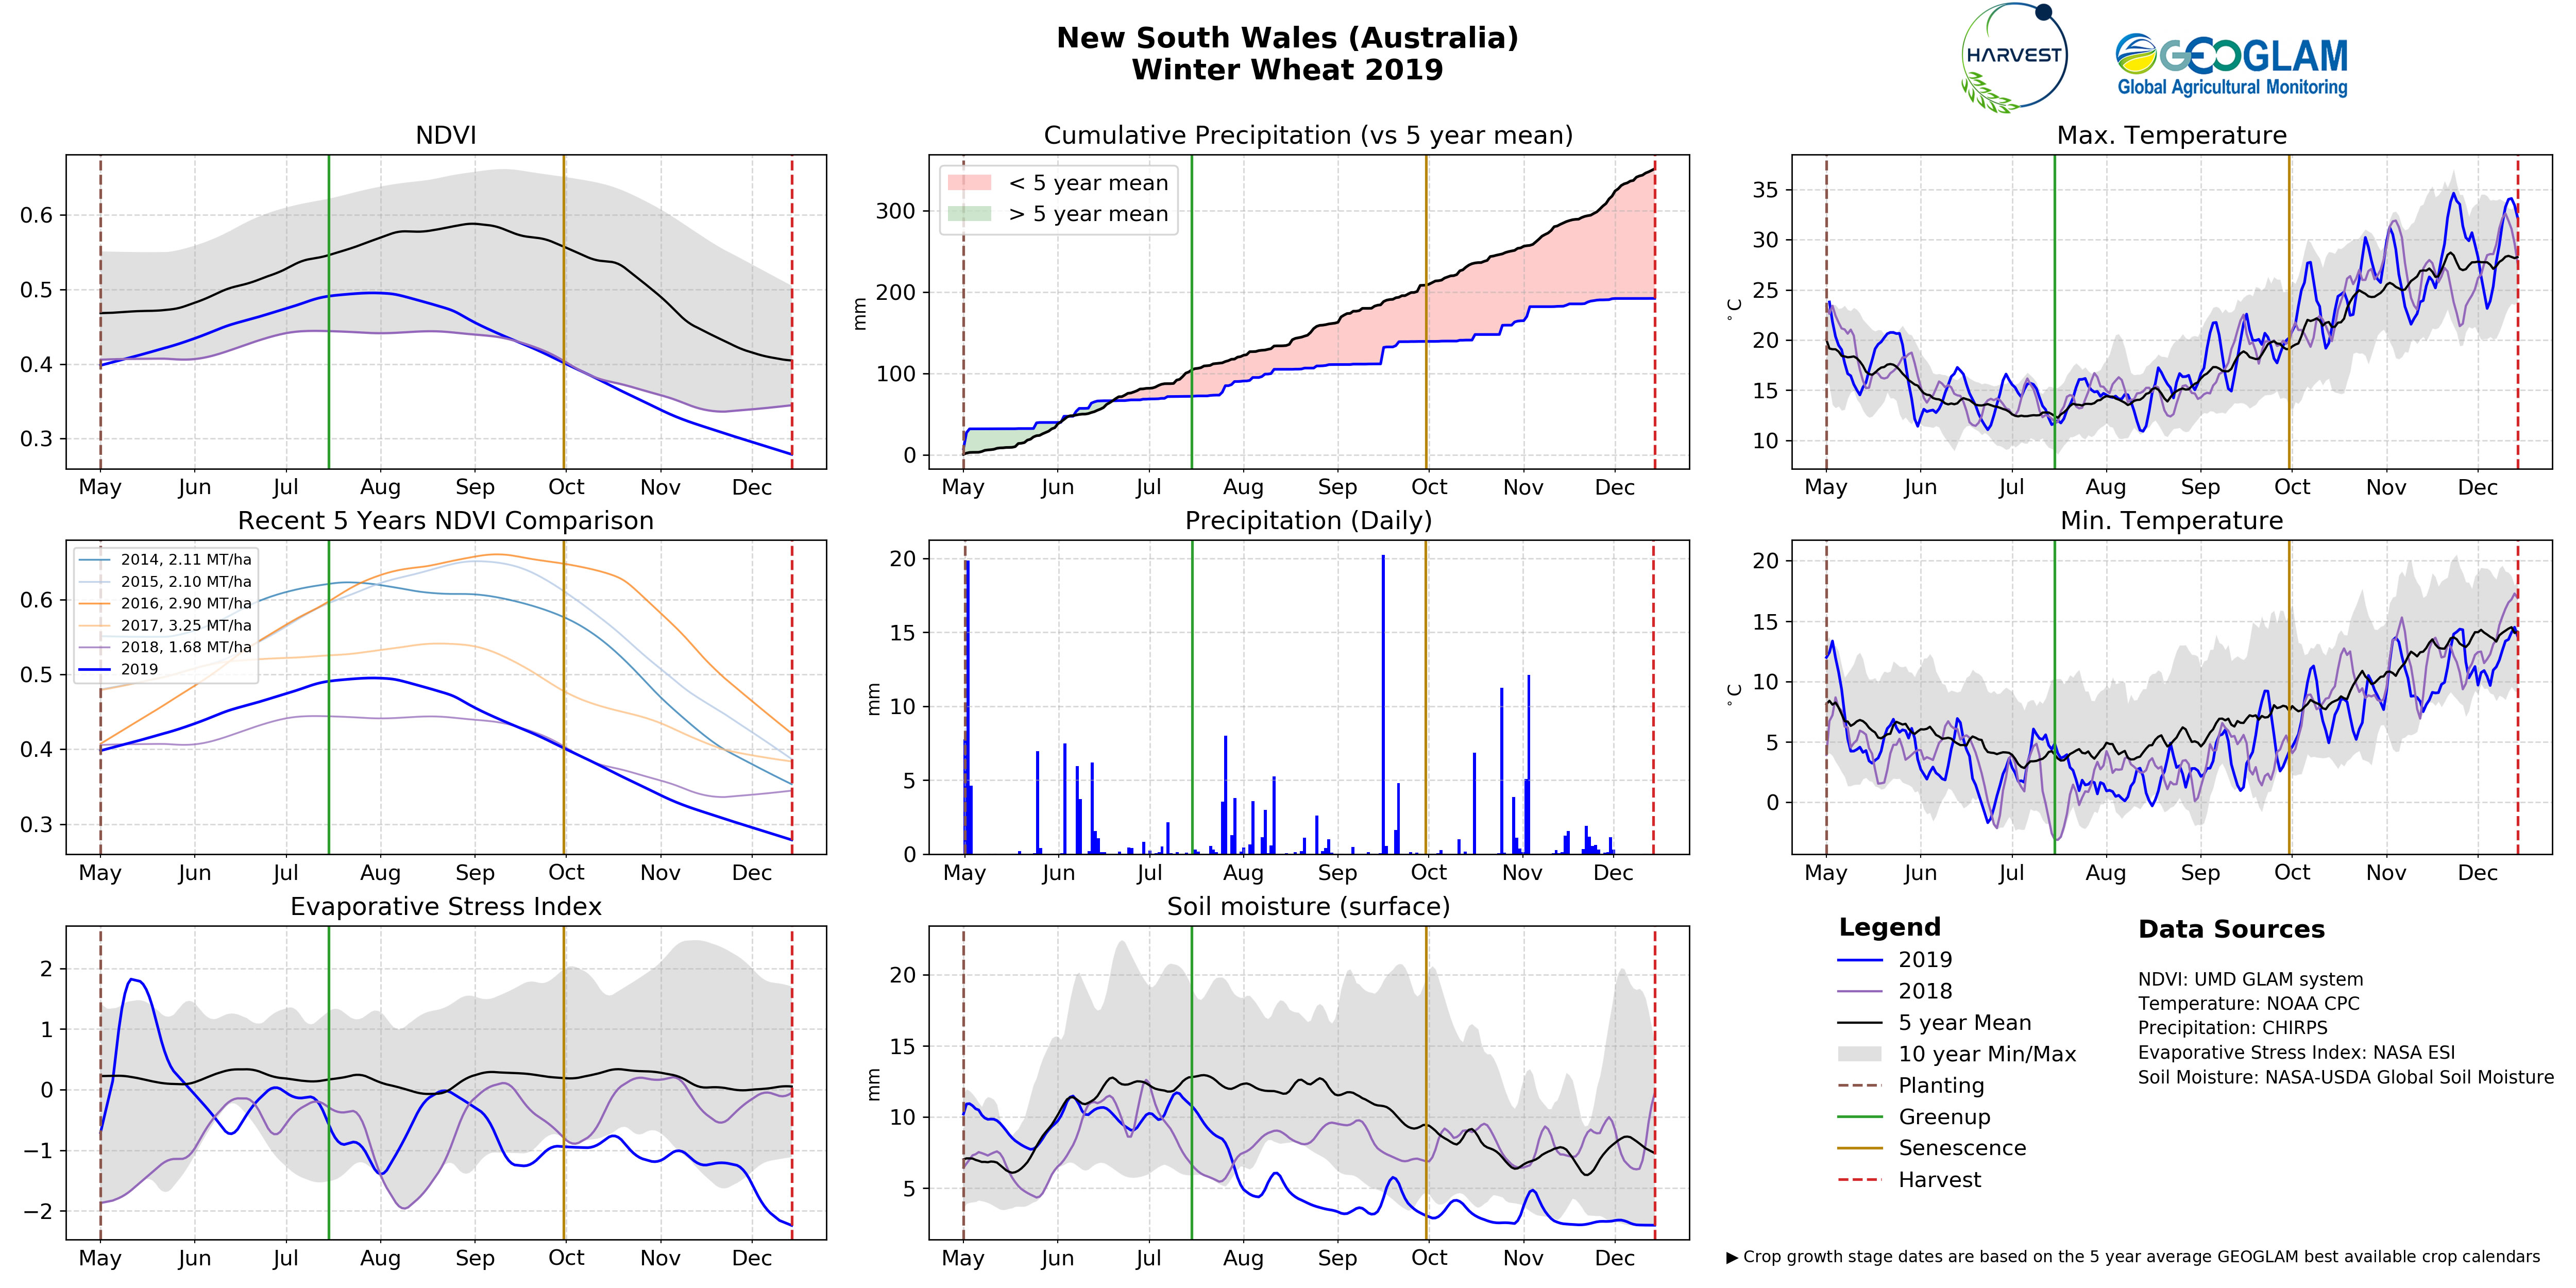
The Crop Condition Plot for New South Wales, Australia covering the 2019-2020 wheat season tells the story of the season and helps the analyst to identify potential issues that might affect crops during the season.
The 2019-2020 wheat season started off under mixed conditions across the state due to mixed rainfall during autumn (March to May), leading to generally favourable soil moisture conditions for sowing. However, during the winter months (June to August), rainfall was below average resulting in dropping ESI and soil moisture levels. By August, the climb in NDVI started to slow and then peaked in early August, well before the normal peak period in late August to early September. Then during the spring (September to November), rainfall continued to be below average, worsening conditions. Resulting in continued low ESI and soil moisture levels along with a continued drop in NDVI values.
Overall, the prolonged period of well below average rainfall had a large impact on crops in New South Wales. The average wheat yield in New South Wales is forecast to be 1.2 metric tonnes per hectare, which is 42% below the 10-year average up to the 2018–19 season (ABARES Australian Crop Report December 2019 edition). With final yields forecasted to so far below the average, final wheat conditions within the Crop Monitor were classified as “poor”.
Example: 2019 maize season in Ohio, the United States
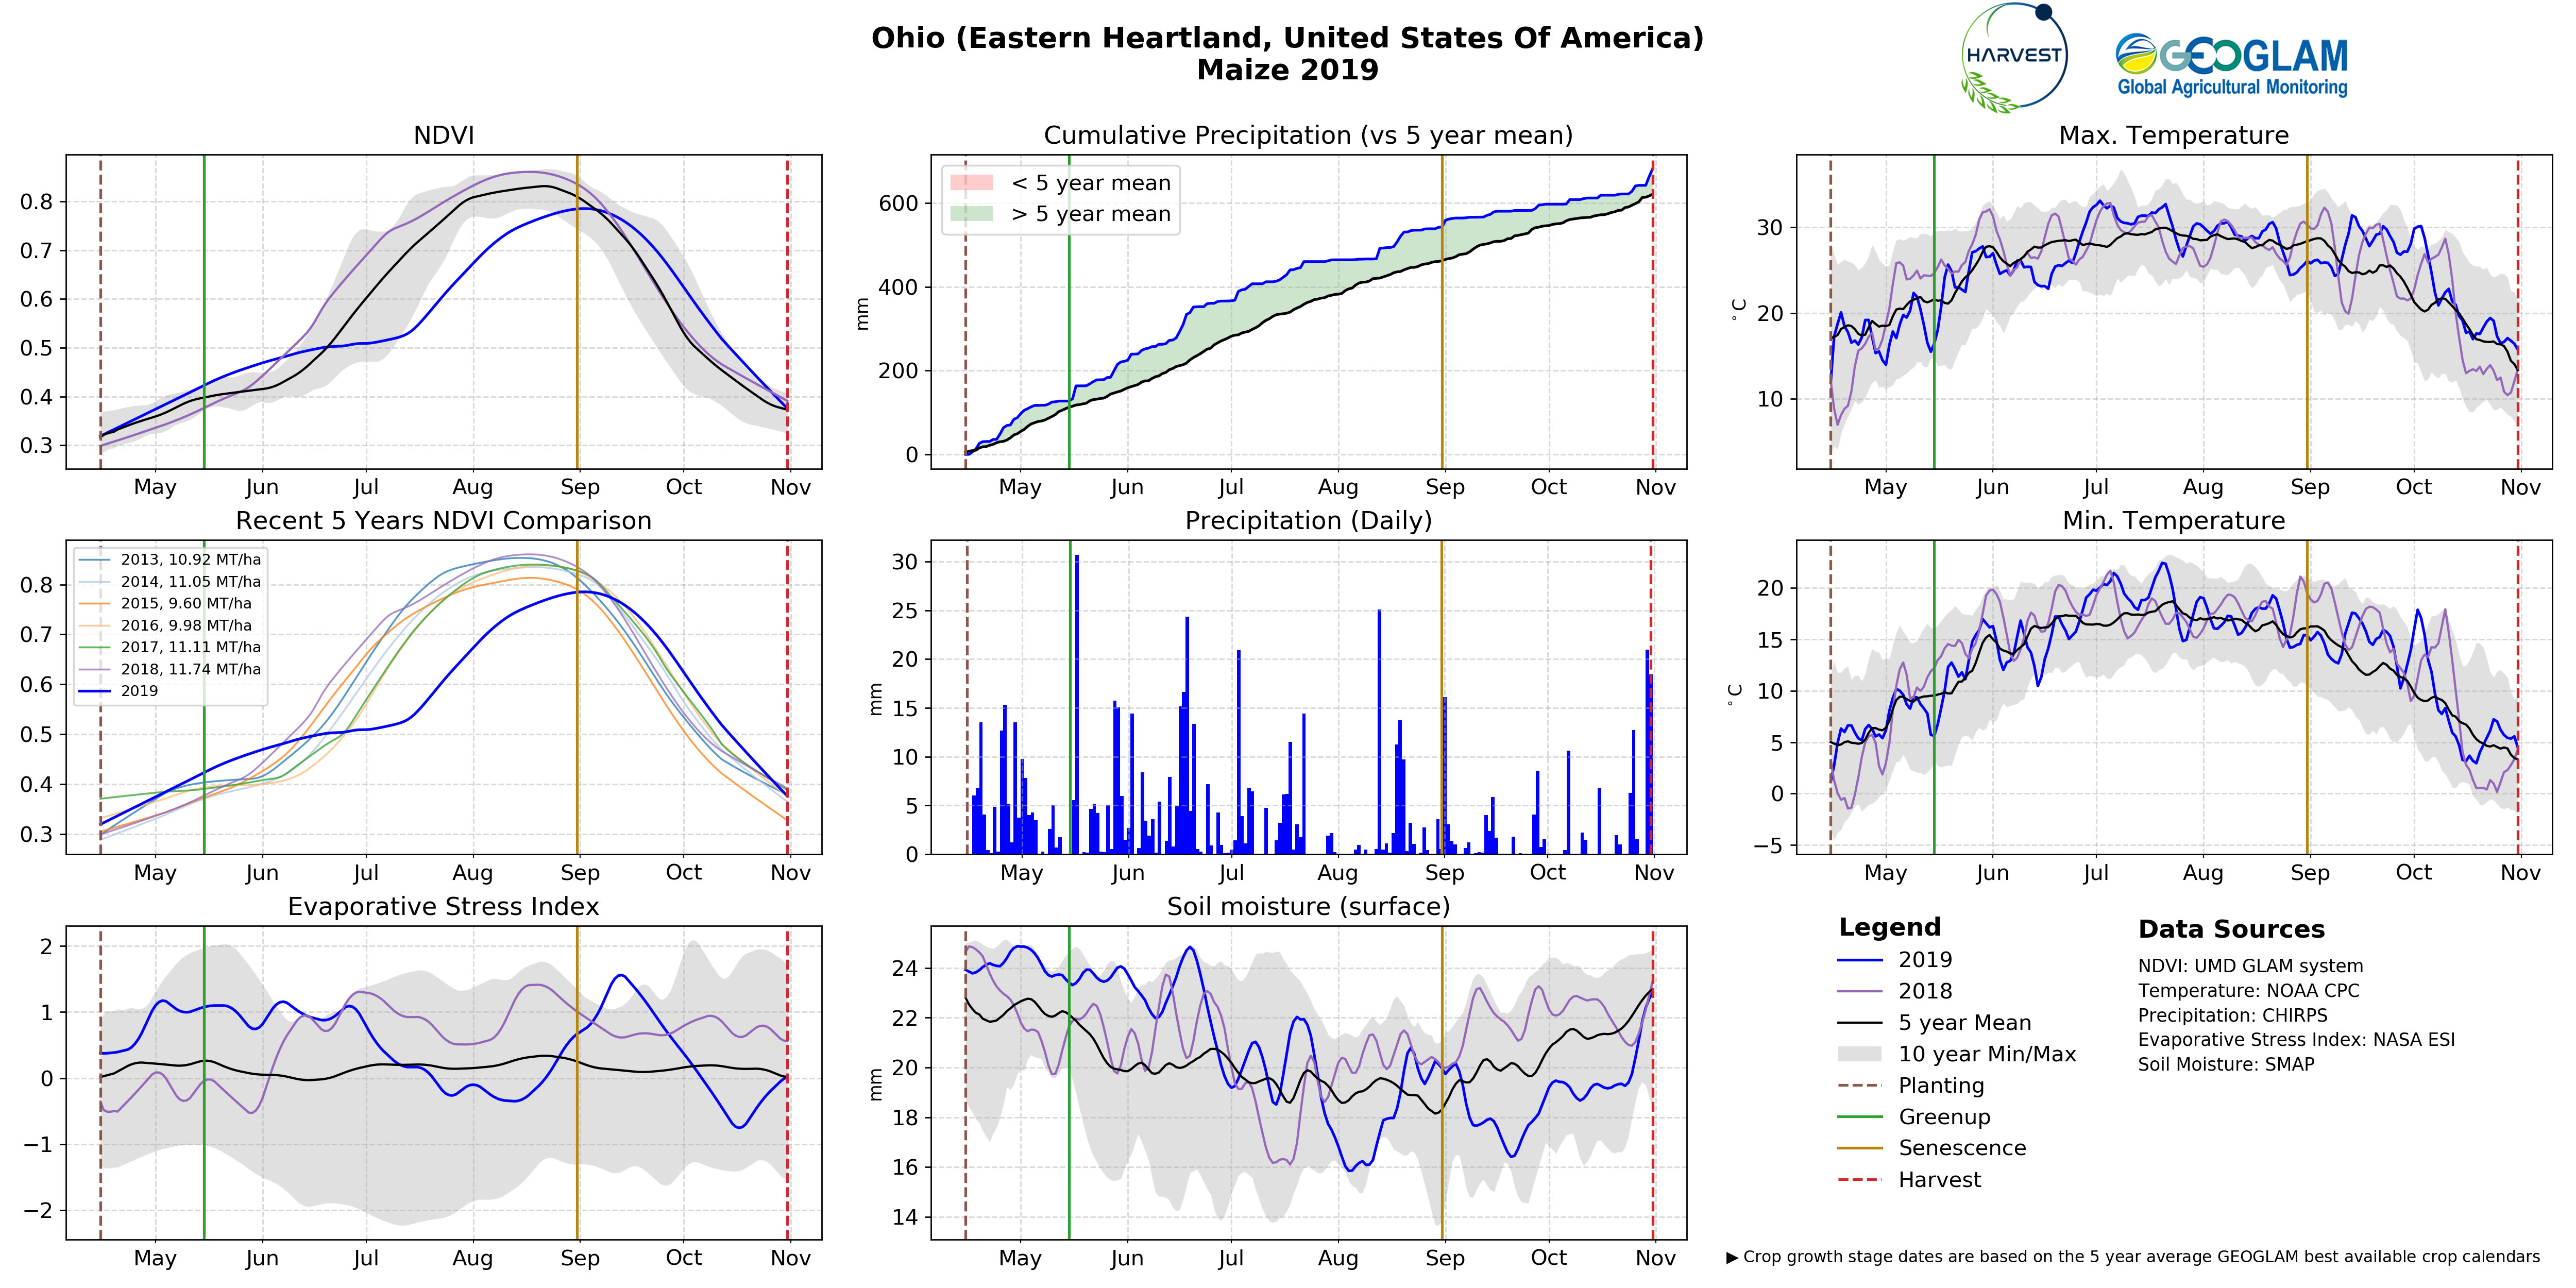
The Crop Condition Plot for Ohio, the United States covering the 2019 maize season tells the story of the season and helps the analyst to identify potential issues that might affect crops during the season.
The season began under mixed conditions due to wet and cooler than average conditions. Heavy rainfall along with spring meltwaters saturated and flooded many fields, leaving farmers unable to conduct sowing until later in the spring. High rainfall values and very high soil moisture values through June combined with lower than average temperatures resulted in sowing being delayed and then a slow start to crop growth. The delayed sowing and slow start to crop development can be seen in the NDVI plot by the month delay in the increase in NDVI values. Near the end of the season, temperatures stayed above normal, helping the maize crop receive additional heat units for development. During harvest, an uptick in rainfall can be observed at the start of November, potentially hampering harvesting operations and increasing grain moisture levels.
Overall, due to the wet and cool start to the season, there was a reduction in total sown area along with a reduction in yields compared to the previous year.
Full access to all of the most current Crop Condition plots can be found in the Crop Monitor Exploring Tool.
Data Sources:
NDVI: UMD GLAM system http://pekko.geog.umd.edu/usda/test/
NASA Evaporative Stress Index (ESI): http://catalogue.servirglobal.net/Product?product_id=198
Precipitation: CHIRPS (historical) https://www.chc.ucsb.edu/data/chirps
NOAA CPC precipitation: (For areas outside of CHIRPS spatial coverage) https://www.esrl.noaa.gov/psd/data/gridded/data.cpc.globalprecip.html
Precipitation Forecast: CHIRPS-GEFS https://chc.ucsb.edu/data/chirps-gefs
Soil Moisture: NASA-USDA Global soil moisture, utilizing SMOS data https://gimms.gsfc.nasa.gov/SMOS/jbolten/FAS/
Temperature: NOAA CPC https://www.esrl.noaa.gov/psd/data/gridded/data.cpc.globaltemp.html